APIs and tools

Use scripting APIs and tools to perform feature analyses.

Three large cards showing three ArcGIS data sources: a green Living Atlas icon, a purple ArcGIS Online icon, and a blue ArcGIS Hub icon.

Find data sources

Discover data in ArcGIS that you can use for feature analysis.


A light gray map of Atlanta with a legend panel describing blue markers for stores and orange markers for restaurants.

Create data sources

Import, create, and generate data for feature analysis.


Enrich Layer tool with U.S. block groups selected, variables for total, female, and male population listed, and multicolored census polygons displayed.

Enrich data sources

Enrich data with demographic information and local business facts using the spatial analysis service.


A human geography map of San Francisco with dense point data and highlighted analysis clusters in red and orange, alongside a side panel with controls to run analysis, clear results, and toggle pre-calculated results.

Perform a feature analysis

Perform a feature analysis using ArcGIS REST JS.


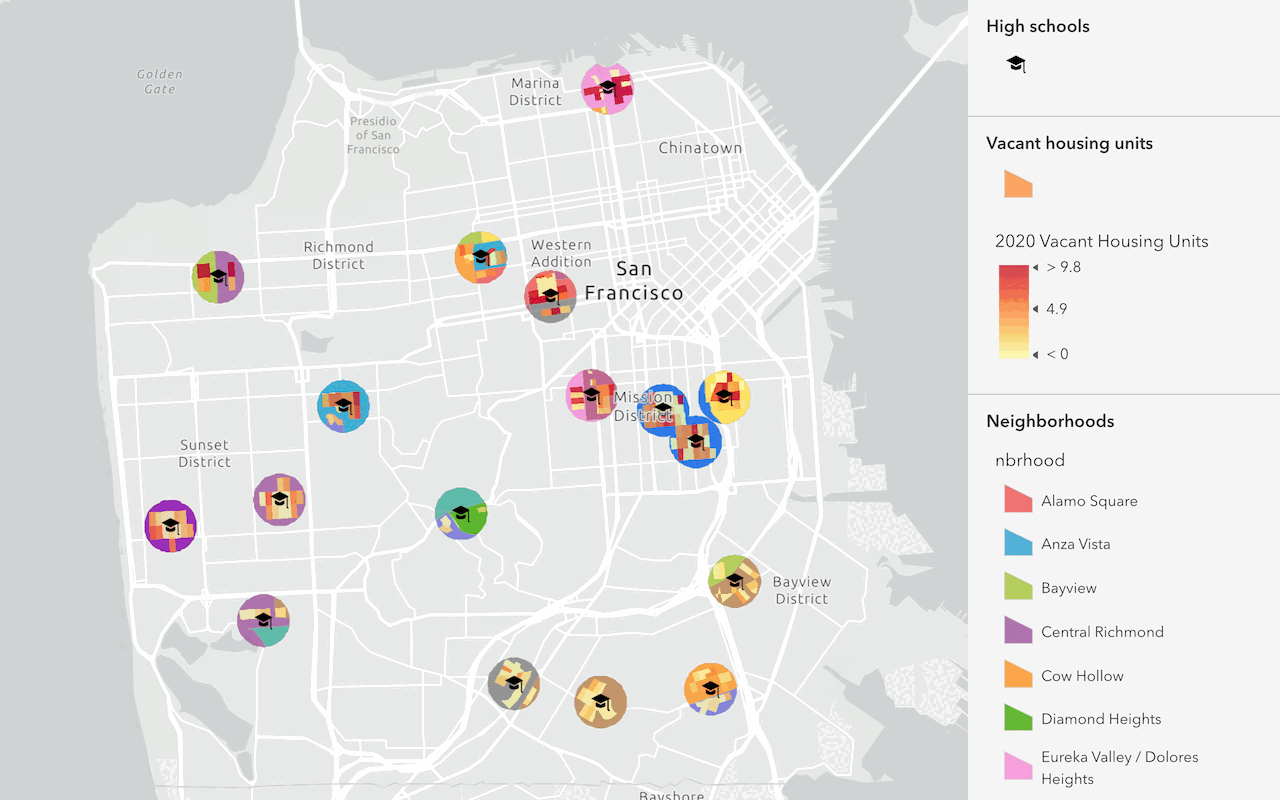
A light gray map of San Francisco with graduation-cap icons marking high schools and a panel showing a yellow-to-red gradient indicating 2020 vacant housing units by location.

Find and extract data

Find data with attribute and spatial queries using find analysis operations.


A choropleth map of San Francisco census blocks shaded by average home value, with a five-class color ramp from light yellow to dark red and a legend showing value ranges from 200,000 up to over 2,000,000.

Combine data

Overlay, join, and dissolve features using combine analysis operations.
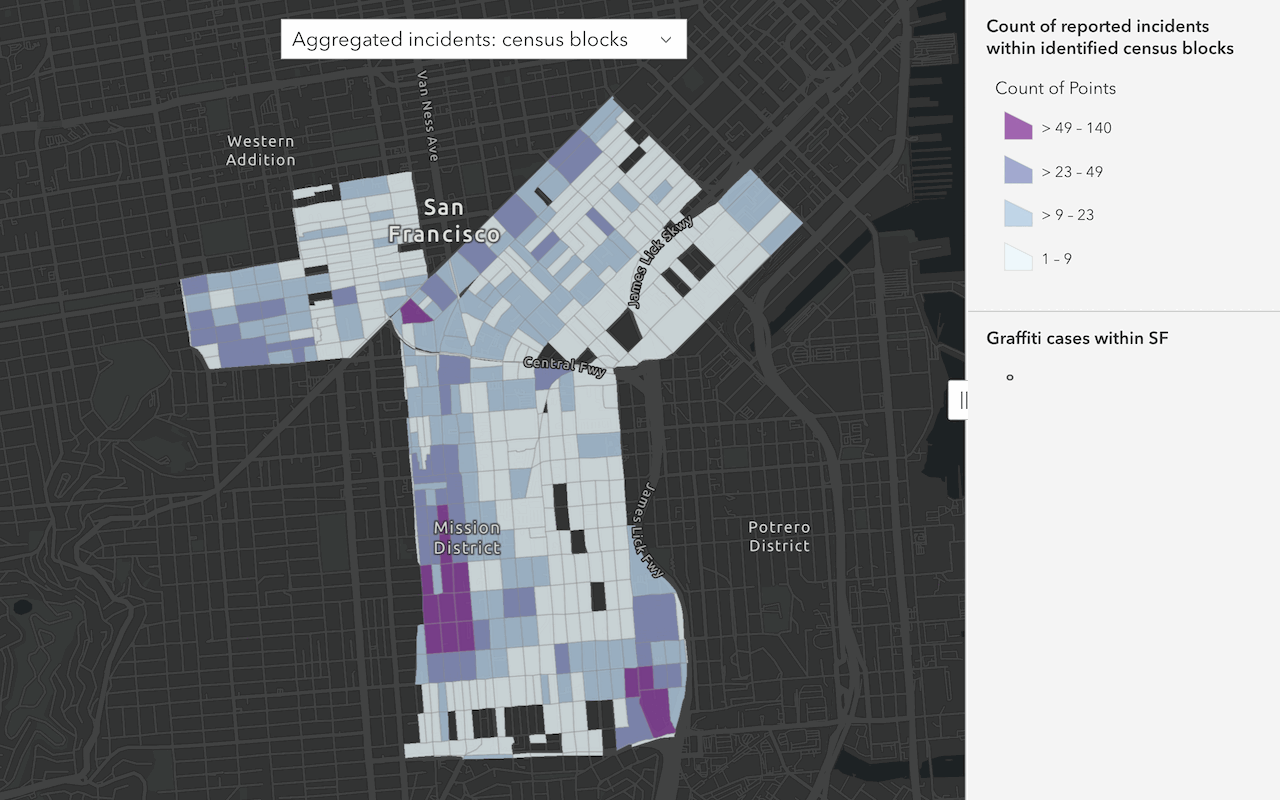

A dark gray map of San Francisco with census blocks shaded from light blue to purple to show aggregated graffiti incident counts, with a legend for count ranges and selected analysis area.

Summarize data

Aggregate and summarize features using summarize analysis operations.
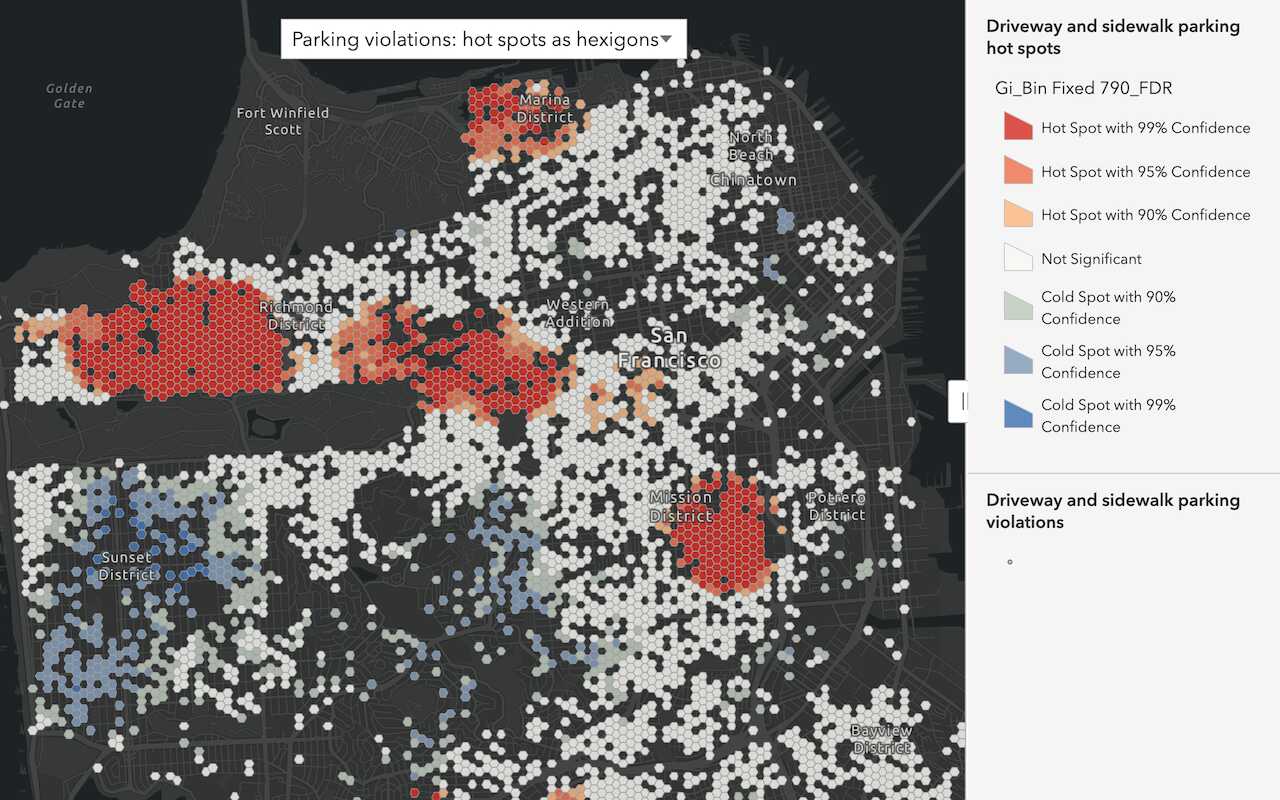

A dark gray map of San Francisco with hexagon bins colored by parking-violation hot and cold spot significance, showing red hot spots in the Richmond and Mission areas and blue cold spots in the Sunset district.

Discover patterns in data

Find patterns and trends in data using spatial analysis operations.


Your browser is no longer supported. Please upgrade your browser for the best experience. See our browser deprecation post for more details.