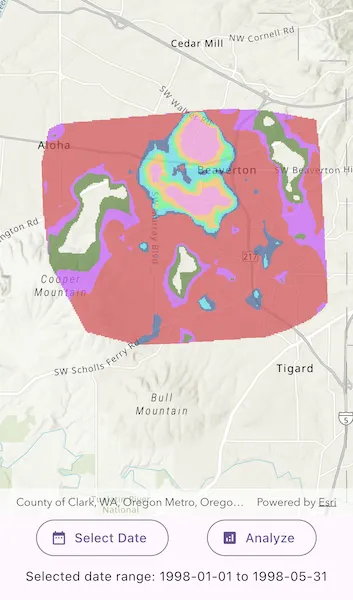
Use a geoprocessing service and a set of features to identify statistically significant hot spots and cold spots.
Use case
This tool identifies statistically significant spatial clusters of high values (hot spots) and low values (cold spots). For example, a hotspot analysis based on the frequency of 911 calls within a set region.
How to use the sample
Select a date range (between 1998-01-01 and 1998-05-31) from the dialog and tap on Analyze. The results will be shown on the map upon successful completion of the GeoprocessingJob.
How it works
- Create a
GeoprocessingTaskwith the URL set to the endpoint of a geoprocessing service. - Create a query string with the date range as an input of
GeoprocessingParameters. - Use the
GeoprocessingTaskto create aGeoprocessingJobwith theGeoprocessingParametersinstance. - Start the
GeoprocessingJoband wait for it to complete and return aGeoprocessingResult. - Get the resulting
ArcGISMapImageLayerusingGeoprocessingResult.mapImageLayer. - Add the layer to the map’s operational layers.
Relevant API
- GeoprocessingJob
- GeoprocessingParameters
- GeoprocessingResult
- GeoprocessingTask
Tags
analysis, density, geoprocessing, hot spots, hotspots
Sample code
analyze_hotspots.dart
//// Copyright 2026 Esri//// Licensed under the Apache License, Version 2.0 (the "License");// you may not use this file except in compliance with the License.// You may obtain a copy of the License at////   https://www.apache.org/licenses/LICENSE-2.0//// Unless required by applicable law or agreed to in writing, software// distributed under the License is distributed on an "AS IS" BASIS,// WITHOUT WARRANTIES OR CONDITIONS OF ANY KIND, either express or implied.// See the License for the specific language governing permissions and// limitations under the License.//
import 'package:arcgis_maps/arcgis_maps.dart';import 'package:arcgis_maps_sdk_flutter_samples/common/common.dart';import 'package:flutter/material.dart';
class AnalyzeHotspots extends StatefulWidget {  const AnalyzeHotspots({super.key});
  @override  State<AnalyzeHotspots> createState() => _AnalyzeHotspotsState();}
class _AnalyzeHotspotsState extends State<AnalyzeHotspots>    with SampleStateSupport {  // Create a controller for the map view.  final _mapViewController = ArcGISMapView.createController();
  // Create a geoprocessing task for the hot spot analysis service.  final _hotspotTask = GeoprocessingTask(    uri: Uri.parse(      'https://sampleserver6.arcgisonline.com/arcgis/rest/services/911CallsHotspot/GPServer/911%20Calls%20Hotspot',    ),  );
  // The valid date range for the service data.  final _minimumDate = DateTime(1998);  final _maximumDate = DateTime(1998, 5, 31);
  // The selected date range for analysis.  late DateTimeRange _selectedDateRange;
  // The current geoprocessing job.  GeoprocessingJob? _hotspotJob;
  // A flag for when the map view is ready and controls can be used.  var _ready = false;
  // A flag for when the geoprocessing task fails to load.  var _taskLoadFailed = false;
  // A flag for when analysis is running.  var _analysisInProgress = false;
  @override  void initState() {    super.initState();    // Initialize the date range to the full range supported by the service.    _selectedDateRange = DateTimeRange(start: _minimumDate, end: _maximumDate);  }
  @override  void dispose() {    // Cancel the job if it is still running when the sample is closed.    _hotspotJob?.cancel().ignore();    super.dispose();  }
  @override  Widget build(BuildContext context) {    return Scaffold(      body: SafeArea(        top: false,        left: false,        right: false,        child: Stack(          children: [            Column(              children: [                Expanded(                  // Add a map view to the widget tree and set a controller.                  child: ArcGISMapView(                    controllerProvider: () => _mapViewController,                    onMapViewReady: onMapViewReady,                  ),                ),                Row(                  mainAxisAlignment: MainAxisAlignment.spaceEvenly,                  children: [                    // Button to pick the analysis date range.                    OutlinedButton.icon(                      onPressed: _analysisInProgress ? null : chooseDateRange,                      icon: const Icon(Icons.date_range),                      label: const Text('Select Date'),                    ),                    OutlinedButton.icon(                      // Button to start the hotspot analysis.                      onPressed: _ready && !_analysisInProgress                          ? analyzeHotspots                          : null,                      icon: const Icon(Icons.analytics),                      label: const Text('Analyze'),                    ),                  ],                ),                Padding(                  padding: const EdgeInsets.only(top: 8, bottom: 12),                  child: Text(                    // Show the currently selected date range below the action buttons.                    'Selected date range: '                    '${formatDate(_selectedDateRange.start)} to '                    '${formatDate(_selectedDateRange.end)}',                  ),                ),              ],            ),            LoadingIndicator(              // Show the indicator while loading the task, unless loading has failed, or while analysis is running.              visible: (!_ready && !_taskLoadFailed) || _analysisInProgress,            ),          ],        ),      ),    );  }
  Future<void> onMapViewReady() async {    // Create a map with the topographic basemap style and an initial viewpoint.    final map = ArcGISMap.withBasemapStyle(BasemapStyle.arcGISTopographic)      // Set the initial viewpoint around the Seattle area where the 911 call data is located.      ..initialViewpoint = Viewpoint.fromCenter(        ArcGISPoint(          x: -13671170,          y: 5693633,          spatialReference: SpatialReference.webMercator,        ),        scale: 57779,      );
    // Set the map on the map view controller.    _mapViewController.arcGISMap = map;
    try {      // Load the geoprocessing task so the Analyze button can create jobs from it.      await _hotspotTask.load();      // Enable the sample controls after the geoprocessing task loads.      setState(() => _ready = true);    } on Exception catch (e) {      // Mark the task load as failed so the loading indicator can be hidden.      setState(() => _taskLoadFailed = true);      // Show the task loading error to the user.      showMessageDialog('Failed to load geoprocessing task:\n$e');    }  }
  Future<void> chooseDateRange() async {    // Show the Flutter date range picker constrained to the sample data range.    final dateRange = await showDateRangePicker(      context: context,      firstDate: _minimumDate,      lastDate: _maximumDate,      initialDateRange: _selectedDateRange,    );
    // If the sample was closed while the picker was open, or the user    // cancels the picker, keep the current date range.    if (!mounted || dateRange == null) return;    // Store the selected date range and refresh the settings display.    setState(() => _selectedDateRange = dateRange);  }
  Future<void> analyzeHotspots() async {    // Ensure the selected date range is valid, allowing the same start and end date    // to represent a single selected calendar day.    if (_selectedDateRange.end.isBefore(_selectedDateRange.start)) {      // Show an error if the selected range is not valid for analysis.      showMessageDialog('Select a valid date range.');      // Stop before creating a geoprocessing job.      return;    }
    // Show the loading indicator and disable controls while the job runs.    setState(() => _analysisInProgress = true);
    try {      // Clear any previous results from the map.      _mapViewController.arcGISMap?.operationalLayers.clear();
      // Create parameters for submitting the geoprocessing job asynchronously.      final parameters = GeoprocessingParameters(        type: GeoprocessingExecutionType.asynchronousSubmit,      );
      // Add a date range query to the geoprocessing parameters.      // Advance the selected end date by one day so the exclusive upper bound      // includes the entire end date selected in the date picker.      final endExclusive = _selectedDateRange.end.add(const Duration(days: 1));      final query =          // Start the where clause with calls on or after the selected start date.          '("DATE" >= date \'${formatDateTime(_selectedDateRange.start)}\' AND '          // Finish the where clause with calls before the day after the selected end date.          '"DATE" < date \'${formatDateTime(endExclusive)}\')';      // Add the query string to the geoprocessing input named "Query".      parameters.inputs['Query'] = GeoprocessingString(query);
      // Create, run, and await the geoprocessing job.      _hotspotJob = _hotspotTask.createJob(parameters);      // Run the job and wait for the geoprocessing result.      final result = await _hotspotJob!.run();
      // Add the result map image layer to the map.      final resultLayer = result.mapImageLayer;      // Check that the service returned a map image layer for display.      if (resultLayer == null) {        // Show an error if the result does not include displayable map output.        showMessageDialog(          'The geoprocessing result did not include a map image layer.',        );        // Stop before trying to load or add a null layer.        return;      }
      // Make the result layer slightly transparent so the basemap remains visible.      resultLayer.opacity = 0.7;      // Load the result layer so its full extent is available.      await resultLayer.load();      // Add the result map image layer to the map's operational layers.      _mapViewController.arcGISMap?.operationalLayers.add(resultLayer);
      // Get the full extent of the result layer.      final fullExtent = resultLayer.fullExtent;      // If the layer has an extent, zoom the map to the analysis results.      if (fullExtent != null) {        // Set the map viewpoint to the result layer extent.        await _mapViewController.setViewpointGeometry(fullExtent);      }    } on Exception catch (e) {      // Get the geoprocessing job error, if the job reported one.      final jobError = _hotspotJob?.error;      // Display the job error when available, otherwise display the caught exception.      showMessageDialog(        jobError != null            ? 'Executing geoprocessing failed:\n${jobError.message}'            : 'An error occurred while analyzing hot spots:\n$e',      );    } finally {      // Clear the stored job reference after it completes or fails.      _hotspotJob = null;      // Hide the loading indicator and re-enable controls.      setState(() => _analysisInProgress = false);    }  }
  // Format a DateTime as yyyy-MM-dd for display and query construction.  String formatDate(DateTime date) {    // Pad month and day values to match the service's expected date format.    String twoDigits(int value) => value.toString().padLeft(2, '0');
    return '${date.year}-${twoDigits(date.month)}-${twoDigits(date.day)}';  }
  // Format a DateTime as the SQL timestamp string expected by the service.  String formatDateTime(DateTime date) => '${formatDate(date)} 00:00:00';}