Hide Table of Contents
esri/dijit/util
esri/layer/pixelFilters
esri/process
esri/support
esri/workers
Class: DotDensityRenderer

require(["esri/renderers/DotDensityRenderer"], function(DotDensityRenderer) { /* code goes here */ });

Description

(Added at v3.7)
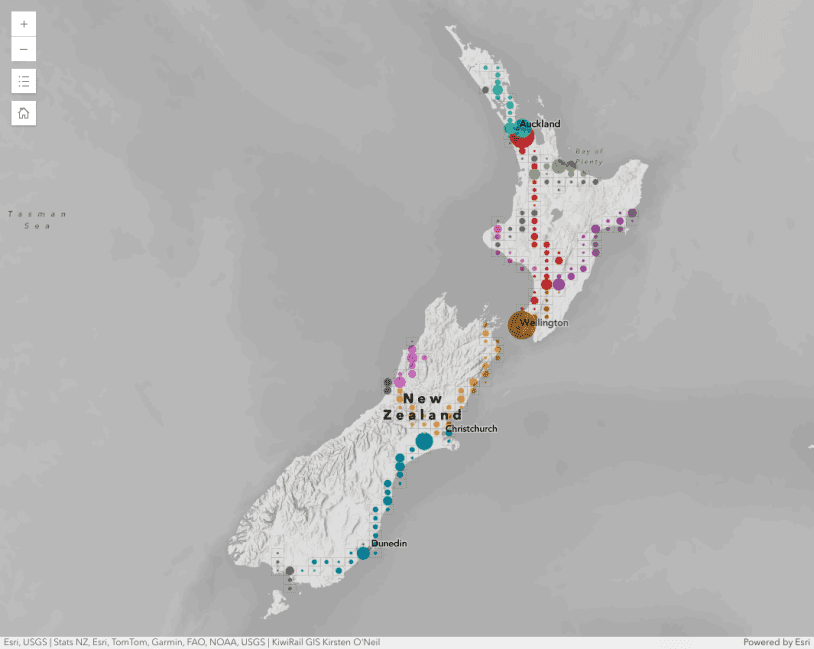
The DotDensityRenderer provides the ability to create dot density visualizations on data. A dot density map can be used to visualize the variation in spatial density of a discrete spatial phenomenon. You can visualize only one variable (for example, 1 dot = 25,000 acres harvested) or multiple variables (for example, 1 green dot = 10,000 acres of corn harvested; 1 brown dot = 10,000 acres of wheat harvested) on one map.

Things to consider when making dot density maps:
  • The fields property allows you to specify multiple fields. You may utilize this property to visualize multiple variables on one map with different colors. For example, use different colors to show the distribution of various ethnic groups.
  • dotValue and dotSize drive the visual effects on your map. A good practice is to set the size and value of the dot so that the feature with the highest value in the layer is ~80% covered in dots.
  • The density on map always changes as the user zooms in or zooms out. Use the ScaleDependentRenderer to set a unique dot density renderer for each scale or zoom range, so the dotValue and dotSize can vary across multiple scale ranges.
  • Dot density maps tend to break down at larger scales. Users start seeing patterns in the random distribution of the dots that do not exist in reality. For example, dot density visualizations on county datasets should only be viewed at the state or regional level.
  • Dot density maps should always use equal area projections to ensure the density is based on the same area measurement everywhere on maps, although WebMercator could be acceptable at larger scales, as the exaggeration of area becomes negligible.
  • Use popups to clearly communicate the actual value of the feature, so the user can explore the map visually and interactively.


More information on working with rendering, smart mapping, and using visual variables can be found in the Data Visualization guide topic and the multiple samples referenced within this topic.

Note: the dot density renderer uses canvas, which is not supported in versions 7 and 8 of Internet Explorer.

Samples

Search for samples that use this class.

Class hierarchy

esri/renderers/Renderer
|_esri/renderers/DotDensityRenderer

Constructors

NameSummary
new DotDensityRenderer(params)Creates a new instance of dot density renderer.

Properties

NameTypeSummary
backgroundColorColorThe color to be used for the background of the symbol.
dotShapeStringThe shape to be used for the dot.
dotSizeNumberThe size of the dot in pixels.
dotValueNumberThe value that a dot represents.
fieldsObject[]An array of objects, where each object defines a field to be mapped and its color.
outlineLineSymbolThe line symbol to use on the outline of the feature.

Methods

NameReturn typeSummary
getColor(graphic, options?)ColorGets the color for the Graphic.
getOpacity(graphic, options?)NumberReturns the opacity value for the specified graphic.
getRotationAngle(graphic, options?)NumberReturns the angle of rotation (in degrees) for the graphic calculated using rotationInfo.
getSize(graphic, options?)NumberReturn the symbol size (in pixels) for the graphic, calculated using sizeInfo.
getSymbol(graphic)SymbolGets the symbol for the Graphic.
setBackgroundColor(color)NoneUpdates the background color of the shape.
setDotSize(size)NoneUpdates the size of the dot.
setDotValue(value)NoneUpdates the value that a dot represents.
setOutline(outline)NoneUpdates the outline symbol of the shape.
toJson()ObjectConverts object to its ArcGIS Server JSON representation.
Constructor Details

new DotDensityRenderer(params)

Creates a new instance of dot density renderer.
Parameters:
<Object> params Required An object with various options. Refer to the options table for details.
params properties:
<Color> backgroundColor Optional The color to be used for the background of the symbol. By default no background color will be applied.
<String> dotShape Optional The shape to be used for the dot. Can be a "square" or a "circle". The default is a "square".
<Number> dotSize Optional The size of the dot in pixels.
<Number> dotValue Required The value that a dot represents.

Typically one dot is more than one. For example if the value of the field being mapped is 150,000 and the dotValue is 1,000 the feature will have 150 dots randomly placed within the boundary of the feature. Values are rounded up. A value of 499 would not get a dot. A value of 500 would get one dot.
<Object[]> fields Required An array of objects, where each object defines a field to be mapped and its color.
[
  {
    name: <String>,  
    color : <Color>
  },
  ...
]
  • Name represents the name of the field to be mapped.
  • Color represents the color of the dot.
<LineSymbol> outline Optional The line symbol to use on the outline of the feature. By default no outline will be applied.
Sample:
require(["esri/renderers/DotDensityRenderer", ... ], function(DotDensityRenderer, ... ){
  var dotDensityRenderer = new DotDensityRenderer({
    fields: [{
      name: "M163_07",
      color: new Color([52, 114, 53])
    }],
    dotValue: 4000,
    dotSize: 2
  });

  layer.setRenderer(dotDensityRenderer);
});
Property Details

<Color> backgroundColor

The color to be used for the background of the symbol. By default no background color will be applied.

<String> dotShape

The shape to be used for the dot.
Known values: "square" | "circle"
Default value: "square"

<Number> dotSize

The size of the dot in pixels.

<Number> dotValue

The value that a dot represents.

<Object[]> fields

An array of objects, where each object defines a field to be mapped and its color. Required.
[
  {
    name: <String>,  
    color : <Color>
  },
  ...
]
  • Name represents the name of the field to be mapped.
  • Color represents the color of the dot.

<LineSymbol> outline

The line symbol to use on the outline of the feature. By default no outline will be applied.
Method Details

getColor(graphic, options?)

Gets the color for the Graphic. (Added at v3.8)
Return type: Color
Parameters:
<Graphic> graphic Required Graphic to get color from.
<Object> options Optional This optional parameter supports colorInfo. If none is provided, the Renderer.colorInfo will be used.

getOpacity(graphic, options?)

Returns the opacity value for the specified graphic. This is calculated using the opacityInfo definition. (Added at v3.11)
Return type: Number
Parameters:
<Graphic> graphic Required Returns the opacity value appropriate for the given graphic. This value is calculated based on the opacityInfo definition.
<Object> options Optional This optional parameter supports opacityInfo. If none is provided, the Renderer.opacityInfo will be used.

getRotationAngle(graphic, options?)

Returns the angle of rotation (in degrees) for the graphic calculated using rotationInfo. (Added at v3.7)
Return type: Number
Parameters:
<Graphic> graphic Required An input graphic for which you want to get the angle of rotation.
<Object> options Optional This optional parameter supports rotationInfo. If none is provided, the Renderer.rotationInfo will be used.

getSize(graphic, options?)

Return the symbol size (in pixels) for the graphic, calculated using sizeInfo. (Added at v3.7)
Return type: Number
Parameters:
<Graphic> graphic Required The graphic for which you want to calculate the symbol size.
<Object> options Optional This optional parameter supports sizeInfo. If none is provided, the Renderer.sizeInfo will be used.

getSymbol(graphic)

Gets the symbol for the Graphic.
Return type: Symbol
Parameters:
<Graphic> graphic Required Graphic to symbolize. Used when creating a custom renderer.

setBackgroundColor(color)

Updates the background color of the shape. For the changes to take effect, you need to call GraphicsLayer.redraw after calling this method.
Parameters:
<Color> color Required Background color.

setDotSize(size)

Updates the size of the dot. Size represents screen pixels. For the changes to take effect, you need to call GraphicsLayer.redraw after calling this method.
Parameters:
<Number> size Required The size of the dot in pixels.

setDotValue(value)

Updates the value that a dot represents. For the changes to take effect, you need to call GraphicsLayer.redraw after calling this method.
Parameters:
<Number> value Required The value that a dot represents.

setOutline(outline)

Updates the outline symbol of the shape. For the changes to take effect, you need to call GraphicsLayer.redraw after calling this method.
Parameters:
<LineSymbol> outline Required The line symbol to use on the outline of the feature.

toJson()

Converts object to its ArcGIS Server JSON representation. (Added at v2.1)
Return type: Object
Show Modal