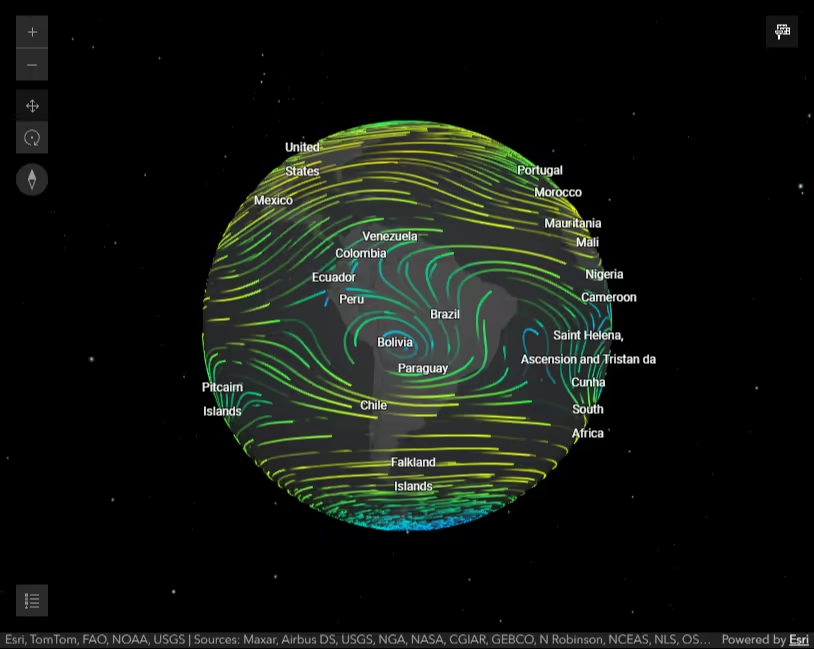
This sample shows how to add an instance of a multidimensional ImageryTileLayer to a Map component from a portalItem. The ImageryTileLayer in this sample contains the soil moisture and soil temperature information at different altitudes as recorded between 10/22/2015 8:00:00 PM GMT-07:00 and 10/23/2015 11:00:00 AM GMT-07:00. The data was downloaded from NCEP Products Inventory.
How it works
When the application starts, an ImageryTileLayer is initialized with a multidimensionalSubset. The multidimensionalSubset returns only the dimensional slices that meet the criteria. In this case, the soil temperature info will not be available at altitude of 3 meters. This means if user moves the altitude slider thumb to 3 meters while soil temperature information is visible then nothing will be displayed on the map since this information is not available within the layer’s multidimensionalSubset.
      // Set the multidimensionalSubset on the layer. Limit the      // stdZ dimension from 0 - 1.6m for the soil temperature variable.      // Nothing is displayed at 3 meters when tsoil@dbll variable info is being displayed      const multidimensionalSubset = new MultidimensionalSubset({        subsetDefinitions: [          {            variableName: "soilw@dbll", // soil moisture            dimensionName: "StdTime",            values: [1445569200000, 1445623200000],            isSlice: false,          },          {            variableName: "soilw@dbll", // soil moisture            dimensionName: "StdZ",            values: [0, 3],            isSlice: false,          },          {            variableName: "tsoil@dbll", // soil temperature            dimensionName: "StdTime",            values: [1445569200000, 1445623200000],            isSlice: false,          },          {            variableName: "tsoil@dbll", // soil temperature            dimensionName: "StdZ",            values: [0, 1.6],            isSlice: false,          },        ],      });
      const layer = new ImageryTileLayer({        portalItem: {          id: "b231d6901d474f6584bdb9655ef2be4e",        },        title: "Soil temp, moisture",        multidimensionalSubset,      });
Users can choose to display the soil moisture or soil temperature variable in the Map by picking a variable name from the drop down list. This will update the layer’s multidimensionalDefinition to display the selected variable. Then, the statistics of the layer’s renderer will be updated to match the variable’s statistics.
      // Change the layer's variable name corresponding the selected variable in the calcite-select      // variable names in this case represent soil moisture or soil temperature      function changeVariableName(variableName) {        const multidimensionalDefinition = layer.multidimensionalDefinition;
        // filter the data by the variable that user selected set the layer's        // multidimensionalDefinition by changing the dimensional definition variable name.        multidimensionalDefinition.forEach((def) => (def.variableName = variableName));        layer.multidimensionalDefinition = multidimensionalDefinition;
        // update statistics for the layer's stretch renderer to match        // statistics associated with the chosen variable        // layer.serviceRasterInfo.multidimensionalInfo - returns multidimensional info from the service        const renderer = layer.renderer.clone();        const dimensions = layer.serviceRasterInfo.multidimensionalInfo;        const variable = dimensions.variables.find((variable) => variable.name === variableName);        renderer.customStatistics = variable.statistics;        layer.renderer = renderer;      }
Users can also visualize how soil moisture or temperature changes at different altitudes by moving the altitude slider thumb, or how it changes over time by playing the Time Slider component. The following function runs whenever the altitude slider thumb is moved.
      // Update layer's stdZ dimension on the map to show the soil temp      // or soil moisture at that altitude as user adjust slider handle      altitudeSlider.addEventListener("arcgisChange", () => {        if (!layer.loaded) {          return;        }        // set the altitude or StdZ dimension of the layer corresponding to the slider's thumb location        const multidimensionalDefinition = layer.multidimensionalDefinition;        // find the stdZ dimension definition from the layer's multidimensionalDefinition        const depthDef = multidimensionalDefinition.find((def) => def.dimensionName === "StdZ");
        // set the slider thumb to the first altitude found in the StdZ altitude        if (depthDef.values[0] === altitudeSlider.values[0]) {          return;        }
        depthDef.values[0] = altitudeSlider.values[0];        layer.multidimensionalDefinition = multidimensionalDefinition;      });