Query a feature table for statistics, grouping and sorting by different fields.
Use case
You can use statistical queries, grouping and sorting to process large amounts of data saved in feature tables. This is helpful for identifying trends and relationships within the data, which can be used to support further interpretations and decisions. For example, a health agency can use information on medical conditions occurring throughout a country to identify at-risk areas or demographics, and decide on further action and preventive measures.
How to use the sample
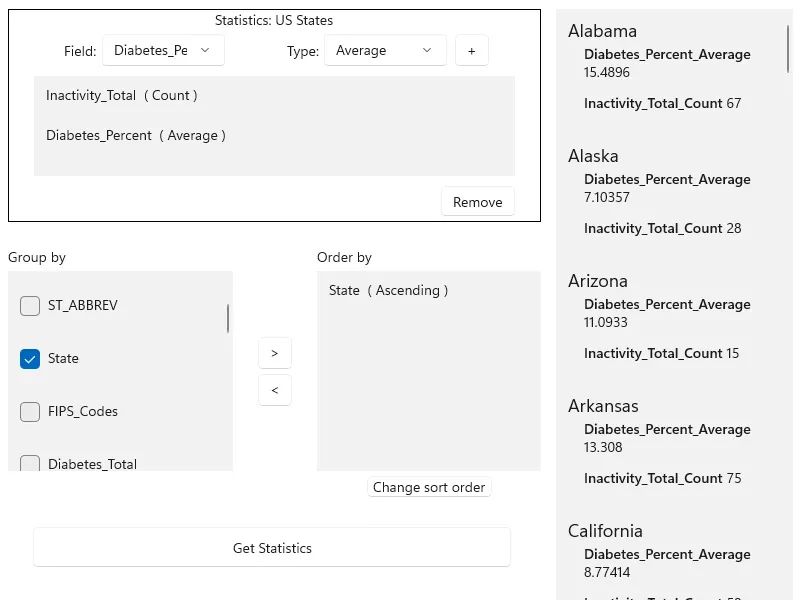
The sample will start with some default options selected. You can immediately click the “Get Statistics” button to see the results for these options. There are several ways to customize your queries:
- You can add statistic definitions to the top-left table using the combo boxes and “Add” button. Select a table row and click “Remove” to remove a definition.
- To change the Group-by fields, check the box by the field you want to group by in the bottom-left list view.
- To change the Order-by fields, select a Group-by field (it must be checked) and click the ”>>” button to add it to the Order-by table. To remove a field from the Order-by table, select it and click the ”<<” button. To change the sort order of the Order-by field, the cells of the “Sort Order” column are combo-boxes that may be either ASCENDING or DESCENDING.
How it works
- Create a
ServiceFeatureTableusing the URL of a feature service and load the table. - Get the feature tables field names list with
featureTable.Fields. - Create
StatisticDefinitions specifying the field to compute statistics on and theStatisticTypeto compute. - Create
StatisticsQueryParameterspassing in the list of statistic definitions. - To have the results grouped by fields, add the field names to the query parameters’
GroupByFieldNamescollection. - To have the results ordered by fields, create
OrderBys, specifying the field name andSortOrder. Pass theseOrderBys to the parameters’OrderByFieldscollection. - To execute the query, call
featureTable.QueryStatisticsAsync(queryParameters). - Get the
StatisticQueryResult. From this, you can get an iterator ofStatisticRecords to loop through and display.
Relevant API
- Field
- OrderBy
- QueryParameters
- ServiceFeatureTable
- StatisticDefinition
- StatisticRecord
- StatisticsQueryParameters
- StatisticsQueryResult
- StatisticType
About the data
This sample uses a Diabetes, Obesity, and Inactivity by US County feature layer hosted on ArcGIS Online.
Tags
correlation, data, fields, filter, group, sort, statistics, table
Sample code
// Copyright 2017 Esri.//// Licensed under the Apache License, Version 2.0 (the "License"); you may not use this file except in compliance with the License.// You may obtain a copy of the License at: http://www.apache.org/licenses/LICENSE-2.0//// Unless required by applicable law or agreed to in writing, software distributed under the License is distributed on an// "AS IS" BASIS, WITHOUT WARRANTIES OR CONDITIONS OF ANY KIND, either express or implied. See the License for the specific// language governing permissions and limitations under the License.
using Esri.ArcGISRuntime.Data;using Microsoft.UI.Xaml;using Microsoft.UI.Xaml.Controls;using Microsoft.UI.Xaml.Data;using System;using System.Collections.Generic;using System.Collections.ObjectModel;using System.Linq;using System.Threading.Tasks;
namespace ArcGIS.WinUI.Samples.StatsQueryGroupAndSort{    [ArcGIS.Samples.Shared.Attributes.Sample(        name: "Statistical query group and sort",        category: "Data",        description: "Query a feature table for statistics, grouping and sorting by different fields.",        instructions: "The sample will start with some default options selected. You can immediately click the \"Get Statistics\" button to see the results for these options. There are several ways to customize your queries:",        tags: new[] { "correlation", "data", "fields", "filter", "group", "sort", "statistics", "table" })]    public partial class StatsQueryGroupAndSort    {        // URI for the US states map service        private Uri _usStatesServiceUri = new Uri("https://services.arcgis.com/jIL9msH9OI208GCb/arcgis/rest/services/Counties_Obesity_Inactivity_Diabetes_2013/FeatureServer/0");
        // US states feature table        private FeatureTable _usStatesTable;
        // Collection of (user-defined) statistics to use in the query        private ObservableCollection<StatisticDefinition> _statDefinitions = new ObservableCollection<StatisticDefinition>();
        // Selected fields for grouping results        private List<string> _groupByFields = new List<string>();
        // Collection to hold fields to order results by        private ObservableCollection<OrderBy> _orderByFields = new ObservableCollection<OrderBy>();
        public StatsQueryGroupAndSort()        {            InitializeComponent();
            // Initialize the US states feature table and populate UI controls            _ = Initialize();        }
        private async Task Initialize()        {            // Create the US states feature table            _usStatesTable = new ServiceFeatureTable(_usStatesServiceUri);
            try            {                // Load the table                await _usStatesTable.LoadAsync();
                // Fill the fields combo and "group by" list with fields from the table                FieldsComboBox.ItemsSource = _usStatesTable.Fields;                GroupFieldsListBox.ItemsSource = _usStatesTable.Fields;
                // Set the (initially empty) collection of fields as the "order by" fields list data source                OrderByFieldsListBox.ItemsSource = _orderByFields;
                // Fill the statistics type combo with values from the StatisticType enum                StatTypeComboBox.ItemsSource = Enum.GetValues(typeof(StatisticType)).OfType<StatisticType>().Select(e => e.ToString());
                // Set the (initially empty) collection of statistic definitions as the statistics list box data source                StatFieldsListBox.ItemsSource = _statDefinitions;            }            catch (Exception e)            {                await new MessageDialog2(e.ToString(), "Error").ShowAsync();            }        }
        // Execute a statistical query using the parameters defined by the user and display the results        private async void OnExecuteStatisticsQueryClicked(object sender, RoutedEventArgs e)        {            // Verify that there is at least one statistic definition            if (_statDefinitions.Count == 0)            {                ShowMessage("Please define at least one statistic for the query.", "Statistical Query");                return;            }
            // Create the statistics query parameters, pass in the list of statistic definitions            StatisticsQueryParameters statQueryParams = new StatisticsQueryParameters(_statDefinitions);
            // Specify the group fields (if any)            foreach (string groupField in _groupByFields)            {                statQueryParams.GroupByFieldNames.Add(groupField);            }
            // Specify the fields to order by (if any)            foreach (OrderBy orderBy in _orderByFields)            {                statQueryParams.OrderByFields.Add(orderBy);            }
            // Ignore counties with missing data            statQueryParams.WhereClause = "\"State\" IS NOT NULL";
            try            {                // Execute the statistical query with these parameters and await the results                StatisticsQueryResult statQueryResult = await _usStatesTable.QueryStatisticsAsync(statQueryParams);
                // Format the output for display of grouped results in the list view                var groupedResults = statQueryResult.Select(r => new Tuple<string, List<Tuple<string, object>>>(string.Join(", ", r.Group.Values), r.Statistics.Select(x => new Tuple<string, object>(x.Key, x.Value)).ToList()));
                // Apply the results to the list view data source                ResultsList.ItemsSource = groupedResults;            }            catch (Exception ex)            {                await new MessageDialog2(ex.Message, "Error").ShowAsync();            }        }
        // Helper function to show a message        private void ShowMessage(string message, string title)        {            _ = new MessageDialog2(message, title).ShowAsync();        }
        // Handle when the check box for a "group by" field is checked on or off by adding or removing the field from the collection        private void GroupFieldCheckChanged(object sender, RoutedEventArgs e)        {            // Get the check box that raised the event (group field)            CheckBox groupFieldCheckBox = (CheckBox)sender;
            // Get the field name            string fieldName = groupFieldCheckBox.Content.ToString();
            // See if the field is being added or removed from the "group by" list            bool fieldAdded = groupFieldCheckBox.IsChecked == true;
            // See if the field already exists in the "group by" list            bool fieldIsInList = _groupByFields.Contains(fieldName);
            // If the field is being added, and is NOT in the list, add it ...            if (fieldAdded && !fieldIsInList)            {                _groupByFields.Add(fieldName);
                // Also add it to the "order by" list                OrderBy orderBy = new OrderBy(fieldName, SortOrder.Ascending);                _orderByFields.Add(orderBy);            }            // If the field is being removed and it IS in the list, remove it ...            else if (!fieldAdded && fieldIsInList)            {                _groupByFields.Remove(fieldName);
                // Also check for this field in the "order by" list and remove if necessary (only group fields can be used to order results)                OrderBy orderBy = _orderByFields.FirstOrDefault(field => field.FieldName == fieldName);                if (orderBy != null)                {                    // Remove the field from the "order by" list                    _orderByFields.Remove(orderBy);                }            }        }
        // Create a statistic definition and add it to the collection based on the user selection in the combo boxes        private void AddStatisticClicked(object sender, RoutedEventArgs e)        {            // Verify that a field name and statistic type has been selected            if (FieldsComboBox.SelectedValue == null || StatTypeComboBox.SelectedValue == null) { return; }
            // Get the chosen field name and statistic type from the combo boxes            string fieldName = FieldsComboBox.SelectedValue.ToString();            StatisticType statType = Enum.Parse<StatisticType>(StatTypeComboBox.SelectedValue as string);
            // Check if this statistic definition has already be created (same field name and statistic type)            StatisticDefinition existingStatDefinition = _statDefinitions.FirstOrDefault(def => def.OnFieldName == fieldName && def.StatisticType == statType);
            // If it doesn't exist, create it and add it to the collection (use the field name and statistic type to build the output alias)            if (existingStatDefinition == null)            {                StatisticDefinition statDefinition = new StatisticDefinition(fieldName, statType, fieldName + "_" + statType.ToString());                _statDefinitions.Add(statDefinition);            }        }
        // Toggle the sort order (ascending/descending) for the field selected in the sort fields list        private void ChangeFieldSortOrder(object sender, RoutedEventArgs e)        {            // Verify that there is a selected sort field in the list            OrderBy selectedSortField = OrderByFieldsListBox.SelectedItem as OrderBy;            if (selectedSortField == null) { return; }
            // Create a new order field info to define the sort for the selected field            OrderBy newOrderBy = new OrderBy(selectedSortField.FieldName, selectedSortField.SortOrder);
            // Toggle the sort order from the current value            if (newOrderBy.SortOrder == SortOrder.Ascending)            {                newOrderBy.SortOrder = SortOrder.Descending;            }            else            {                newOrderBy.SortOrder = SortOrder.Ascending;            }
            // Add the new OrderBy at the same location in the collection and remove the old one            _orderByFields.Insert(_orderByFields.IndexOf(selectedSortField), newOrderBy);            _orderByFields.Remove(selectedSortField);        }
        // Remove the selected statistic definition from the list        private void RemoveStatisticClicked(object sender, RoutedEventArgs e)        {            // Verify that there is a selected statistic definition            if (StatFieldsListBox.SelectedItem == null) { return; }
            // Get the selected statistic definition and remove it from the collection            StatisticDefinition selectedStat = StatFieldsListBox.SelectedItem as StatisticDefinition;            _statDefinitions.Remove(selectedStat);        }
        // Add the selected field in the "group by" list to the "order by" list        private void AddSortFieldClicked(object sender, RoutedEventArgs e)        {            // Verify that there is a selected field in the "group by" list            if (GroupFieldsListBox.SelectedItem == null) { return; }
            // Get the name of the selected field and ensure that it's in the list of selected group fields (checked on in the list, e.g.)            string selectedFieldName = GroupFieldsListBox.SelectedItem.ToString();            if (!_groupByFields.Contains(selectedFieldName))            {                ShowMessage("Only fields used for grouping can be used to order results.", "Order fields");                return;            }
            // Verify that the field isn't already in the "order by" list            OrderBy existingOrderBy = _orderByFields.FirstOrDefault(f => f.FieldName == selectedFieldName);            if (existingOrderBy == null)            {                // Create a new OrderBy for this field and add it to the collection (default to ascending sort order)                OrderBy newOrderBy = new OrderBy(selectedFieldName, SortOrder.Ascending);                _orderByFields.Add(newOrderBy);            }        }
        // Remove the selected field from the list of "order by" fields        private void RemoveSortFieldClicked(object sender, RoutedEventArgs e)        {            // Verify that there is a selected item in the "order by" list            if (OrderByFieldsListBox.SelectedItem == null) { return; }
            // Get the selected OrderFieldOption object and remove it from the collection            OrderBy selectedOrderBy = OrderByFieldsListBox.SelectedItem as OrderBy;            _orderByFields.Remove(selectedOrderBy);        }    }
    // Value converter to return strings in a specified format    public class StringFormatConverter : IValueConverter    {        public object Convert(object value, Type targetType, object parameter, string language)        {            // Make sure there's a value            if (value == null)                return null;
            // Make sure there's a converter parameter (format string, "{0:0,0}", for example)            if (parameter == null)                return value;
            // Return the formatted string            return string.Format((string)parameter, value);        }
public object ConvertBack(object value, Type targetType, object parameter, string language) { throw new NotImplementedException(); } }}<UserControl x:Class="ArcGIS.WinUI.Samples.StatsQueryGroupAndSort.StatsQueryGroupAndSort" xmlns="http://schemas.microsoft.com/winfx/2006/xaml/presentation" xmlns:x="http://schemas.microsoft.com/winfx/2006/xaml" xmlns:local="using:ArcGIS.WinUI.Samples.StatsQueryGroupAndSort">
<UserControl.Resources> <local:StringFormatConverter x:Key="StringFormatter" /> </UserControl.Resources>
<Grid MinWidth="300" MinHeight="300" MaxWidth="1000" MaxHeight="800" HorizontalAlignment="Center" VerticalAlignment="Center"> <Grid.ColumnDefinitions> <ColumnDefinition Width="2*" /> <ColumnDefinition Width="*" /> </Grid.ColumnDefinitions> <Grid.RowDefinitions> <RowDefinition Height="Auto" /> <RowDefinition Height="Auto" /> <RowDefinition Height="*" /> </Grid.RowDefinitions> <Grid Grid.Row="0" Grid.Column="0" BorderBrush="Black" BorderThickness="1"> <Grid.ColumnDefinitions> <ColumnDefinition Width="2*" /> <ColumnDefinition Width="3*" /> <ColumnDefinition Width="2*" /> <ColumnDefinition Width="3*" /> <ColumnDefinition Width="2*" /> </Grid.ColumnDefinitions> <Grid.RowDefinitions> <RowDefinition /> <RowDefinition /> <RowDefinition /> <RowDefinition /> </Grid.RowDefinitions> <TextBlock Grid.Row="0" Grid.Column="1" Grid.ColumnSpan="3" HorizontalAlignment="Center" VerticalAlignment="Center" Text="Statistics: US States" /> <TextBlock Grid.Row="1" HorizontalAlignment="Right" VerticalAlignment="Center" Text="Field:" /> <ComboBox x:Name="FieldsComboBox" Grid.Row="1" Grid.Column="1" Margin="5" HorizontalAlignment="Stretch" VerticalAlignment="Center"> <ComboBox.ItemTemplate> <DataTemplate> <TextBlock Text="{Binding Name}" /> </DataTemplate> </ComboBox.ItemTemplate> </ComboBox> <TextBlock Grid.Row="1" Grid.Column="2" HorizontalAlignment="Right" VerticalAlignment="Center" Text="Type:" /> <ComboBox x:Name="StatTypeComboBox" Grid.Row="1" Grid.Column="3" Margin="5" HorizontalAlignment="Stretch" VerticalAlignment="Center" /> <Button x:Name="AddStatisticButton" Grid.Row="1" Grid.Column="4" Margin="3" Click="AddStatisticClicked" Content="+" /> <ScrollViewer Grid.Row="2" Grid.ColumnSpan="5" Margin="25,5" MinHeight="100"> <ListBox x:Name="StatFieldsListBox"> <ListBox.ItemTemplate> <DataTemplate> <TextBlock> <Run Text="{Binding OnFieldName}" /> <Run Text=" (" /> <Run Text="{Binding StatisticType}" /> <Run Text=")" /> </TextBlock> </DataTemplate> </ListBox.ItemTemplate> </ListBox> </ScrollViewer> <Button x:Name="RemoveStatField" Grid.Row="3" Grid.Column="3" Grid.ColumnSpan="2" Height="30" Margin="25,5" HorizontalAlignment="Right" VerticalAlignment="Top" Click="RemoveStatisticClicked" Content="Remove" /> </Grid>
<Grid Grid.Row="1" Grid.Column="0" VerticalAlignment="Top" Margin="0,25"> <Grid.ColumnDefinitions> <ColumnDefinition /> <ColumnDefinition Width="Auto" /> <ColumnDefinition /> </Grid.ColumnDefinitions> <Grid.RowDefinitions> <RowDefinition Height="Auto" /> <RowDefinition Height="200" /> <RowDefinition Height="Auto" /> </Grid.RowDefinitions> <TextBlock Grid.Row="0" Margin="0,0,0,5" HorizontalAlignment="Left" VerticalAlignment="Bottom" Text="Group by" /> <ListBox x:Name="GroupFieldsListBox" Grid.Row="1" HorizontalAlignment="Stretch" VerticalAlignment="Stretch"> <ListBox.ItemTemplate> <DataTemplate> <StackPanel Orientation="Horizontal"> <CheckBox Checked="GroupFieldCheckChanged" Content="{Binding Name}" Unchecked="GroupFieldCheckChanged" /> </StackPanel> </DataTemplate> </ListBox.ItemTemplate> </ListBox>
<StackPanel Grid.Row="1" Grid.Column="1" VerticalAlignment="Center" Margin="25,0"> <Button Content=">" HorizontalAlignment="Center" Margin="0,0,0,5" Click="AddSortFieldClicked" /> <Button Content="<" HorizontalAlignment="Center" Click="RemoveSortFieldClicked" /> </StackPanel>
<TextBlock Grid.Row="0" Grid.Column="2" Margin="0,0,0,5" HorizontalAlignment="Left" VerticalAlignment="Bottom" Text="Order by" /> <ListBox x:Name="OrderByFieldsListBox" Grid.Row="1" Grid.Column="2" HorizontalAlignment="Stretch" VerticalAlignment="Stretch"> <ListBox.ItemTemplate> <DataTemplate> <TextBlock> <Run Text="{Binding FieldName}" /> <Run Text=" (" /> <Run Text="{Binding SortOrder}" /> <Run Text=")" /> </TextBlock> </DataTemplate> </ListBox.ItemTemplate> </ListBox> <Button x:Name="SortOrderButton" Grid.Row="2" Grid.Column="2" Margin="0,5,0,0" Padding="5,0" HorizontalAlignment="Center" VerticalAlignment="Top" Click="ChangeFieldSortOrder" Content="Change sort order" /> </Grid>
<Button x:Name="GetStatisticsButton" Grid.Row="2" Grid.Column="0" Height="40" Margin="25,5,30,5" Padding="10,0" HorizontalAlignment="Stretch" VerticalAlignment="Top" Click="OnExecuteStatisticsQueryClicked" Content="Get Statistics" />
<Grid Grid.Row="0" Grid.RowSpan="3" Grid.Column="2" Margin="15,0"> <ListBox x:Name="ResultsList"> <ListBox.ItemTemplate> <DataTemplate> <ListView ItemsSource="{Binding Item2}"> <ListView.Header> <TextBlock Text="{Binding Item1}" FontSize="18" /> </ListView.Header> <ListView.ItemTemplate> <DataTemplate> <TextBlock TextWrapping="Wrap"> <Run Text="{Binding Item1}" FontWeight="SemiBold" /> <Run Text="{Binding Item2}" /> </TextBlock> </DataTemplate> </ListView.ItemTemplate> </ListView> </DataTemplate> </ListBox.ItemTemplate> </ListBox> </Grid> </Grid></UserControl>