First, to use the map widget, call gis.map() and assign it to a variable that you can then query to bring up the widget in the notebook:
import arcgis
from arcgis.gis import GIS
# Create a GIS object, as an anonymous user for this example
gis = GIS()
# Create a map widget
map1 = gis.map('USA') # Passing a place name to the constructor
# will initialize the extent of the map.
map1
Adding single layer
Adding Web Layer to the map
You can add a number of different layer objects, such as FeatureLayer, FeatureCollection, ImageryLayer, or MapImageLayer, to the map. For instance, you can use the following cell to add a FeatureLayer:
world_countries_item = gis.content.get('ac80670eb213440ea5899bbf92a04998')
world_countries_layer = world_countries_item.layers[0]
world_countries_layer
<FeatureLayer url:"https://services.arcgis.com/P3ePLMYs2RVChkJx/arcgis/rest/services/World_Countries/FeatureServer/0">
map1.add_layer(world_countries_layer, options={'opacity':0.4})Similar to FeatureLayers, you can also add ImageryLayers items. You can also specify either a built-in raster function or a custom one for rendering.
map2 = gis.map('USA') # Passing a place name to the constructor
                        # will initialize the extent of the map.
map2
landsat_item = GIS().content.search("Landsat 8 Views", "Imagery Layer", max_items=2)[0]
landsat_item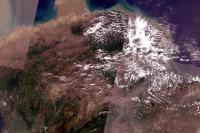
map2.add_layer(landsat_item)To zoom to one or more layers, call the zoom_to_layer() method and pass a layer or list of layers that you want to snap your map to. The supplied item can be a single instance or a list of an Item, Layer, DataFrame, FeatureSet, or FeatureCollection.
The code below shows how to zoom to a single layer:
map2.zoom_to_layer(landsat_item)map3 = gis.map('USA') # Passing a place name to the constructor
# will initialize the extent of the map.
map3
prep_item = GIS().content.search("Precipitation", "Map Image Layer", max_items=2)[1]
prep_item
prep_layer = prep_item.layers[1]
prep_layer
<MapFeatureLayer url:"https://maps3.arcgisonline.com/arcgis/rest/services/A-16/Koeppen-Geiger_Observed_and_Predicted_Climate_Shifts/MapServer/1">
map3.add_layer(prep_layer)
map3.zoom_to_layer(prep_layer)
Adding local and in-memory layers to the map
Add a Spatially-Enabled Data Frame (SeDF)
We can read census data on major cities and load the data into a Spatially Enabled DataFrame (SeDF), which will then allow us to visualize the points by calling the plot() method off the SeDF's spatial accessor and passing the map you created to it.
# create an anonymous connection to ArcGIS Online and get a public item
census_item = gis.content.get("85d0ca4ea1ca4b9abf0c51b9bd34de2e")
census_flayer = census_item.layers[0]

# Specify a SQL query and get a sub-set of the original data as a DataFrame
census_df = census_flayer.query(where="AGE_45_54 < 450").sdf

# Visualize the top 5 records
census_df.head()| FID | NAME | CLASS | ST | STFIPS | PLACEFIPS | CAPITAL | POP_CLASS | POPULATION | POP2010 | ... | MARHH_NO_C | MHH_CHILD | FHH_CHILD | FAMILIES | AVE_FAM_SZ | HSE_UNITS | VACANT | OWNER_OCC | RENTER_OCC | SHAPE | |
|---|---|---|---|---|---|---|---|---|---|---|---|---|---|---|---|---|---|---|---|---|---|
| 0 | 306 | Purdue University | Census Designated Place | IN | 18 | 1862388 | 6 | 12365 | 12183 | ... | 244 | 9 | 23 | 491 | 2.66 | 1362 | 104 | 4 | 1254 | {"x": -9676280.259129459, "y": 4928486.7435240... | |
| 1 | 600 | Stanford | Census Designated Place | CA | 06 | 0673906 | 6 | 15179 | 13809 | ... | 689 | 13 | 32 | 1230 | 2.77 | 3999 | 86 | 790 | 3123 | {"x": -13599607.21449169, "y": 4498534.6279709... | |
| 2 | 682 | Fort Carson | Census Designated Place | CO | 08 | 0827370 | 6 | 13891 | 13813 | ... | 319 | 39 | 421 | 2319 | 3.59 | 2629 | 180 | 15 | 2434 | {"x": -11664455.032700792, "y": 4684537.534384... | |
| 3 | 742 | Storrs | Census Designated Place | CT | 09 | 0973980 | 6 | 15569 | 15344 | ... | 276 | 14 | 18 | 489 | 2.69 | 1737 | 166 | 592 | 979 | {"x": -8043406.213645851, "y": 5131741.8140288... | |
| 4 | 1035 | Camp Pendleton South | Census Designated Place | CA | 06 | 0610561 | 6 | 10450 | 10616 | ... | 389 | 37 | 169 | 2500 | 3.69 | 2865 | 296 | 11 | 2558 | {"x": -13066535.250599463, "y": 3925680.810605... |
5 rows × 50 columns
map4 = GIS().map("United States")
map4
map4.zoom = 4
map4.center = [39,-98]
census_df.spatial.plot(map_widget= map4)True
Add an in-memory FeatureSet
Besides adding in the the SeDF, we can also add a FeatureSet. For example, below we will search for the USA freeway layer and visualize it by adding it to the map widget as a FeatureSet object returned by the query method. Once added, we then draw it with default line symbols.
freeway_item = gis.content.search('title:USA Freeway System AND owner:esri_dm',
                                   item_type = 'Feature Layer')[0]
freeway_item
freeway_sdf = freeway_item.layers[0]
freeway_fset = freeway_sdf.query(where="DIST_KM>2800", as_df=False)
freeway_fset
<FeatureSet> 7 features
map5 = gis.map('USA', 10)
map5
map5.center=[34.05,-118.2]
map5.zoom=12
map5.basemap='dark-gray'
map5.add_layer(freeway_fset, {'renderer':'ClassedSizeRenderer',
'field_name':'DIST_KM',
'opacity':0.75})Adding a local raster
A local raster can be read into the map widget as a numpy array with arcgis.raster imported on the machine.
import numpy
import matplotlib.pyplot as plt
from arcgis.raster import Raster
map6 = GIS().map("Newark, NJ")
map6
raster = Raster(r'../../static/img/newark_nj_1922.jpg',
                extent = {"xmin":-74.22655,
                          "ymin":40.712216,
                          "xmax":-74.12544,
                          "ymax":40.773941,
                          "spatialReference":{"wkid":4326}},
                opacity = 0.85)
map6.add_layer(raster)
To immediately release the in-app memory immediate, run the follow cell to remove the raster layer:
map6.remove_layers([raster,])Other operations
Drawing graphics and geometries
Draw geometries
map7 = gis.map("Port of Long Beach")
map7.basemap = "satellite"
map7.zoom = 6
map7
When it comes to adding geometries, we can either create a geometry object and use the draw method to apply the object onto our display, or we can input point, polyline, or polygon as keywords in the draw() method, which will then trigger a user interactive drawing session on the widget.
from arcgis.geometry import Point

pt = Point({"x" : -118.15, "y" : 33.80,
"spatialReference" : {"wkid" : 4326}})map7.draw(pt)map7.draw('polyline')map7.draw('polygon')Draw with symbols and pop-ups
The draw() method can be used to draw a deterministic shape on the map widget when the input shape is a known Geometry object, a list of coordinate pairs, a FeatureSet, or a dict object that represents a geometry. The other way to use draw is to provide users with an interactive sketch and display experience when the input shape is one of the expected strings, e.g. "circle", "ellipse", "Polygon", "Polyline", "MultiPoint", "Point", "rectangle", "triangle".
draw(shape, popup=None, symbol=None, attributes=None)
# The draw method draws a shape on the map widget.
The shape argument can be one of these four objects:
- Known
Geometryobjects: Shape is one of the following: circle, ellipse, Polygon, Polyline, MultiPoint, Point, rectangle, triangle. - Coordinate pair: specified shape as a list of [lat, long]. Eg: [34, -81]
FeatureSet: shape can be a FeatureSet object.Dictobject representing ageometry.
The popup parameter is optional, and if it used, it must be a dict containing title and content as keys that will be displayed when the shape is clicked. In the case of a FeatureSet, title and content are names of attributes of the features in the FeatureSet, rather than actual string values for title and content.
The symbol parameter is also optional, and if it is used, it should be a dict object. See the Symbol Objects page in the ArcGIS REST API documentation for more information. A default symbol is used if one is not specified. A helper utility to get the symbol format for several predefined symbols is available at the Esri symbol selector.
The attributes parameter is again optional, and if it is used, it should be a dict object that specifies a dict containing name value pairs of fields and field values associated with the graphic.
The examples we have seen so far have not been applied with customized symbols and pop-ups. Next, let's follow a quick example that visualizes a predefined Point object with the symbol parameter and draws the nearby hospitals with customized symbols and a self-defined pop-up:
from arcgis.gis import GIS
map7b = GIS().map("Port of Long Beach")
map7b.basemap='gray'
map7b.zoom = 6
map7b
house_symbol = {"angle":0,"xoffset":0,"yoffset":0,"type":"esriPMS",
                "url":"http://static.arcgis.com/images/Symbols/Shapes/RedStarLargeB.png",
                "contentType":"image/png","width":24,"height":24}
map7b.draw(pt, symbol=house_symbol)
Now, let's use the geocode method to find a list of 10 hospitals near the defined Point object:
from arcgis.geocoding import geocode
hospitals = geocode('hospital', location=[-118.15, 33.80], max_locations=10)
len(hospitals)
10
hospital_symbol = {"angle":0,"xoffset":0,"yoffset":0,"type":"esriPMS",
                   "url":"http://static.arcgis.com/images/Symbols/SafetyHealth/Hospital.png",
                   "contentType":"image/png","width":24,"height":24}

for place in hospitals:
    popup={"title" : place['attributes']['PlaceName'],
           "content" : place['attributes']['Place_addr']}
    map7b.draw(place['location'], symbol=hospital_symbol, popup=popup)
Draw sketches interactively
You can draw or sketch graphics on the map interactively using the draw() method. For instance, you can draw and annotate rectangles, ellipses, arrow marks, etc. as shown below:
usa_map = GIS().map("USA")
usa_map
usa_map.draw('rectangle')usa_map.draw('circle')If the graphics are no longer needed, you can use the clear_graphics method to remove them.
usa_map.clear_graphics()Customizing layer symbology
While calling the add_layer() method, you can specify a set of renderer instructions as a dictionary to the options parameter. You have seen how to set the transparency for a layer in previous cells. The opacity value ranges from 0 - 1, with 0 being fully transparent and 1 being fully opaque.
You can make use of the "smart mapping" capability to render feature layers with symbology that varies based on an attribute field of that layer. The cell below adds the "USA Freeway System" layer to the map and changes the width of the line segments based on the length of the freeway. Unlike in map5 where freeways are classified in sizes, here you will see freeways classified in colors. For more, checkout smart mapping.
map5b = gis.map('USA', 10)
map5b
map5b.center=[34.05,-118.2]
map5b.zoom=12
map5b.basemap='dark-gray'
map5b.add_layer(freeway_fset, {'renderer':'ClassedColorRenderer',
'field_name':'DIST_KM',
'opacity':0.5})Querying layers in a map
You can list the layers added to the map using the layers property.
map1.layers[<FeatureLayer url:"https://services.arcgis.com/P3ePLMYs2RVChkJx/arcgis/rest/services/World_Countries/FeatureServer/0">]
map5.layers[<FeatureCollection>]
Removing layers in a map
To remove one or more layers, call the remove_layers() method and pass a list of layers that you want removed. To get a list of valid layers that can be removed, call the layers' property as shown in the previous cell.
The code below shows how to remove the USA freeways layer:
map2.remove_layers(layers=[landsat_item])Viewing legend
Enable the display of a legend on the map widget by setting the boolean to True:
map5b.legend = Truemap5b.take_screenshot()
Finally, you can turn the legend display off when it no longer needed by executing the following cell:
map5b.legend = FalseConclusion
In Part 3 of this guide series, we have explored how to add single layers (Web Layer, local raster, or an in-memory SeDF) to a map, how to draw graphics and geometries, and how to perform other visualization operations. In the next chapter, we will explore how to display time-enabled data, the nature of drawing with the ArcGIS API for Javascript, and the best practices when rendering a large number of layers in a single map widget.