Create a simple electric distribution report that displays the count of customers and total load per phase by tracing downstream from a given point.
Use case
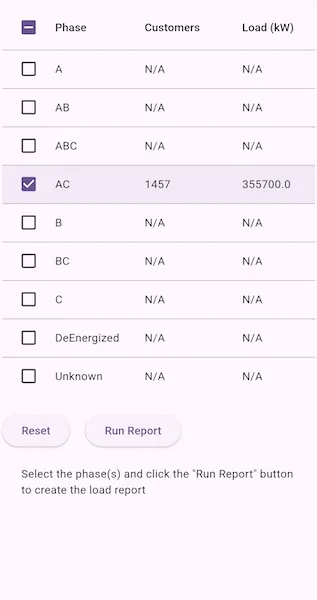
You can use a load report to display the customers per phase as well as the load per phase based on a chosen starting point in a utility network. Load reports are used for electric load restoration and balancing.
How to use the sample
Select phases to be included in the report. Press the “Run Report” button to initiate a downstream trace on the network and create a load report. Pressing “Run Report” again will generate a new load report. Deselect all phases and press the “Reset” button to clear the report.
How it works
- Create a
ServiceGeodatabasewith a feature service URL. - Create and load a
UtilityNetworkusing the service geodatabase, then get an asset type, tier, network attributes, and category by their names. - Create a
UtilityElementfrom the asset type to use as the starting location for the trace. - Create a
UtilityTraceConfigurationfrom the utility tier. - Create a
UtilityCategoryComparisonwhere “ServicePoint” category exists. - Reset the
functionsproperty of the trace configuration with a newUtilityTraceFunctionadding a “Service Load” network attribute where this category comparison applies. This will limit the function results. - Set
outputConditionwith the category comparison to limit the element results. - Get a base condition from the utility tier’s default trace configuration.
- Create
UtilityTraceParameterspassing indownstreamutility trace type and the default starting location. Set itstraceConfigurationproperty with the trace configuration above. - Populate a list of phases using the network attribute’s
codedValuesproperty. - When the “Run Report” button is tapped, run a trace for every checked
CodedValuein the phases list. Do this by creating aUtilityTraceOrConditionwith the base condition and aUtilityNetworkAttributeComparisonwhere the “Phases Current” network attribute does not include the coded value. - Display the count of “Total Customers” using the
elementsproperty of the result, and the result of “Total Load” using the first and only output infunctionOutputsproperty.
Relevant API
- UtilityAssetType
- UtilityCategoryComparison
- UtilityDomainNetwork
- UtilityElement
- UtilityElementTraceResult
- UtilityNetwork
- UtilityNetworkAttribute
- UtilityNetworkAttributeComparison
- UtilityNetworkDefinition
- UtilityNetworkSource
- UtilityTerminal
- UtilityTier
- UtilityTraceConfiguration
- UtilityTraceFunction
- UtilityTraceParameters
- UtilityTraceResult
- UtilityTraceType
- UtilityTraversability
About the data
The Naperville electrical network feature service, hosted on ArcGIS Online (authentication required: this is handled within the sample code), contains a utility network used to run the subnetwork-based trace shown in this sample.
Additional information
Using utility network on ArcGIS Enterprise 10.8 requires an ArcGIS Enterprise member account licensed with the Utility Network user type extension. Please refer to the utility network services documentation.
Tags
condition barriers, downstream trace, network analysis, subnetwork trace, trace configuration, traversability, upstream trace, utility network, validate consistency
Sample code
// Copyright 2025 Esri//// Licensed under the Apache License, Version 2.0 (the "License");// you may not use this file except in compliance with the License.// You may obtain a copy of the License at////   https://www.apache.org/licenses/LICENSE-2.0//// Unless required by applicable law or agreed to in writing, software// distributed under the License is distributed on an "AS IS" BASIS,// WITHOUT WARRANTIES OR CONDITIONS OF ANY KIND, either express or implied.// See the License for the specific language governing permissions and// limitations under the License.//
import 'dart:async';
import 'package:arcgis_maps/arcgis_maps.dart';import 'package:arcgis_maps_sdk_flutter_samples/common/common.dart';import 'package:arcgis_maps_sdk_flutter_samples/common/token_challenger_handler.dart';import 'package:flutter/material.dart';
class CreateLoadReport extends StatefulWidget {  const CreateLoadReport({super.key});
  @override  State<CreateLoadReport> createState() => _CreateLoadReportState();}
class _CreateLoadReportState extends State<CreateLoadReport>    with SampleStateSupport {  // The utility network instance.  late UtilityNetwork _utilityNetwork;  // The starting location for the trace.  late UtilityElement _startingLocation;  // The utility tier.  late UtilityTier _utilityTier;  // The phases current attribute.  late UtilityNetworkAttribute _phasesNetworkAttribute;  // The load attribute.  late UtilityNetworkAttribute _loadAttribute;  // The base condition for the trace.  late UtilityTraceConditionalExpression _baseCondition;  // The trace parameters.  late UtilityTraceParameters _traceParameters;  // The phase data list.  var _phaseDataList = <_PhaseData>[];  // The phase coded values.  late List<CodedValue> _phaseCodedValues;
  // A flag when the utility network is loaded and other properties are initialized.  var _ready = false;  // A flag to indicate if the report is ready to run.  var _readyRun = false;  // An error message to display.  var _errorMessage = '';
  @override  void initState() {    super.initState();
    // Set up authentication for the sample server.    // Note: Never hardcode login information in a production application.    // This is done solely for the sake of the sample.    ArcGISEnvironment        .authenticationManager        .arcGISAuthenticationChallengeHandler = TokenChallengeHandler(      'viewer01',      'I68VGU^nMurF',    );
    _initUtilityNetwork();  }
  @override  void dispose() {    // Remove the TokenChallengeHandler and erase any credentials that were generated.    ArcGISEnvironment            .authenticationManager            .arcGISAuthenticationChallengeHandler =        null;    ArcGISEnvironment.authenticationManager.arcGISCredentialStore.removeAll();    super.dispose();  }
  @override  Widget build(BuildContext context) {    return Scaffold(      body: SafeArea(        child: Container(          padding: const EdgeInsets.fromLTRB(10, 20, 10, 10),          child: Stack(            children: [              Column(                spacing: 20,                children: [                  // The data table displaying the load report.                  dataTableWidget(),                  // A row of buttons: reset and run report.                  Row(                    spacing: 20,                    children: [                      ElevatedButton(                        onPressed: _ready ? reset : null,                        child: const Text('Reset'),                      ),                      ElevatedButton(                        onPressed: _readyRun ? runReport : null,                        child: const Text('Run Report'),                      ),                    ],                  ),                  // Instructions text.                  Text(                    'Select the phase(s) and click the "Run Report" button \nto create the load report',                    style: Theme.of(context).textTheme.bodyMedium,                  ),                  // An error message display.                  Visibility(                    visible: _errorMessage.isNotEmpty,                    child: Expanded(                      child: Text(                        _errorMessage,                        style: Theme.of(context).textTheme.customErrorStyle,                      ),                    ),                  ),                ],              ),              // a loading indicator while the utility network is initializing.              LoadingIndicator(                visible: !_ready,                text: 'Initializing utility network...',              ),            ],          ),        ),      ),    );  }
  /// Returns a widget displaying the load report data table.  Widget dataTableWidget() {    return SingleChildScrollView(      scrollDirection: Axis.horizontal,      child: SingleChildScrollView(        child: DataTable(          columnSpacing: 12,          columns: const [            DataColumn(              label: SizedBox(                width: 100,                child: Text('Phase', overflow: TextOverflow.ellipsis),              ),            ),            DataColumn(              label: SizedBox(                width: 110,                child: Text('Customers', overflow: TextOverflow.ellipsis),              ),            ),            DataColumn(              label: SizedBox(                width: 100,                child: Text('Load (kW)', overflow: TextOverflow.ellipsis),              ),            ),          ],          rows: [            for (final phaseData in _phaseDataList)              DataRow(                onSelectChanged: (value) => setState(() {                  phaseData.selected = value ?? false;                  if (!phaseData.selected) {                    // Reset customers and load when not selected.                    phaseData.customers = 0;                    phaseData.load = 0;                  }                  _readyRun = _phaseDataList.any(                    (phaseData) => phaseData.selected,                  );                }),                selected: phaseData.selected,                cells: [                  DataCell(Text(phaseData.phase)),                  DataCell(                    Text(                      phaseData.customers > 0                          ? phaseData.customers.toString()                          : 'N/A',                    ),                  ),                  DataCell(                    Text(                      phaseData.load > 0 ? phaseData.load.toString() : 'N/A',                    ),                  ),                ],              ),          ],        ),      ),    );  }
  /// Initializes the utility network and related properties.  Future<void> _initUtilityNetwork() async {    setState(() => _ready = false);    try {      // Create a service geodatabase from the Naperville Electric feature service.      final serviceGeodatabase = ServiceGeodatabase.withUri(        Uri.parse(          'https://sampleserver7.arcgisonline.com/server/rest/services/UtilityNetwork/NapervilleElectric/FeatureServer',        ),      );      // Initialize the utility network with the service geodatabase.      _utilityNetwork = UtilityNetwork(serviceGeodatabase);      await _utilityNetwork.load();
      // Get the network source, asset group, and asset type for the starting location.      final networkSource = _utilityNetwork.definition?.networkSources          .firstWhere((ns) => ns.name == 'Electric Distribution Device');      final assetGroup = networkSource?.assetGroups.firstWhere(        (ag) => ag.name == 'Circuit Breaker',      );      final assetType = assetGroup?.assetTypes.firstWhere(        (at) => at.name == 'Three Phase',      );      final terminal = assetType?.terminalConfiguration?.terminals.firstWhere(        (t) => t.name == 'Load',      );      final globalId = Guid.fromString(        '{1CAF7740-0BF4-4113-8DB2-654E18800028}',      )!;
      // Create the default starting location.      _startingLocation = _utilityNetwork.createElementWithAssetType(        assetType!,        globalId: globalId,        terminal: terminal,      );
      // Get the utility tier.      _utilityTier = _utilityNetwork.definition!.domainNetworks          .firstWhere((definition) => definition.name == 'ElectricDistribution')          .tiers          .firstWhere((tier) => tier.name == 'Medium Voltage Radial');
      // Get the default trace configuration as the base condition.      _baseCondition =          _utilityTier.getDefaultTraceConfiguration()!.traversability!.barriers!              as UtilityTraceConditionalExpression;
      // Create downstream trace parameters with function outputs.      _traceParameters = UtilityTraceParameters(        UtilityTraceType.downstream,        startingLocations: [_startingLocation],      );      // Specify the result types to include elements and function outputs.      _traceParameters.resultTypes.addAll([        UtilityTraceResultType.elements,        UtilityTraceResultType.functionOutputs,      ]);      // Assign the trace configuration to trace parameters.      _traceParameters.traceConfiguration = _createTraceConfiguration();
      // Create a list of possible phases from a given network attribute      _phaseCodedValues = _createPhaseList();
      // Set the ready state variable to true to enable the sample UI.      setState(() {        _phaseDataList = getPhaseDataList();        _ready = true;      });    } on Exception catch (e) {      setState(() {        _ready = true;        _errorMessage = 'Initialization failed: \n$e';      });    }  }
  /// Returns a default TraceConfiguration for the utility network.  UtilityTraceConfiguration _createTraceConfiguration() {    final traceConfig = _utilityTier.getDefaultTraceConfiguration()!;
    // Service Category for counting total customers.    final servicePointCategory = _getServiceCategoryByName('ServicePoint');
    // The load attribute for counting total load.    _loadAttribute = _utilityNetwork.definition!.networkAttributes.firstWhere(      (attr) => attr.name == 'Service Load',    );
    // Create a comparison to check the existence of service points.    final serviceCategoryComparison = UtilityCategoryComparison.withCategory(      servicePointCategory!,      comparisonOperator: UtilityCategoryComparisonOperator.exists,    );    final addLoadAttributeFunction = UtilityTraceFunction(      UtilityTraceFunctionType.add,      networkAttribute: _loadAttribute,      condition: serviceCategoryComparison,    );    traceConfig.functions.clear();
    // Create function input and output condition.    traceConfig.functions.add(addLoadAttributeFunction);    traceConfig.outputCondition = serviceCategoryComparison;    // Set to false to ensure that service points with incorrect phasing    // (which therefore act as barriers) are not counted with results.    traceConfig.includeBarriers = false;
    return traceConfig;  }
  /// Returns the utility category with the given name.  UtilityCategory? _getServiceCategoryByName(String name) {    final category = _utilityNetwork.definition?.categories.firstWhere(      (category) => category.name == name,    );    return category;  }
  /// Returns the list of coded phase values for the phases current attribute.  /// If the attribute domain is not a coded value domain, returns an empty list.  List<CodedValue> _createPhaseList() {    _phasesNetworkAttribute = _utilityNetwork.definition!.networkAttributes        .firstWhere((attr) => attr.name == 'Phases Current');
    final domain = _phasesNetworkAttribute.domain;    return domain is CodedValueDomain ? domain.codedValues : const [];  }
  /// Runs the load report for the selected phase names.  Future<void> runReport() async {    setState(() => _readyRun = false);
    final selectedPhaseNames = _phaseDataList        .where((phaseData) => phaseData.selected)        .map((phaseData) => phaseData.phase)        .toList();
    // Active coded values matching selection.    final activeValues = _phaseCodedValues        .where((cv) => selectedPhaseNames.contains(cv.name))        .toList();
    if (activeValues.isEmpty) {      setErrorMessage('No phases selected for the report.');      return;    }
    for (final codedValue in activeValues) {      setUtilityTraceOrConditionWithCodedValue(codedValue);      final phaseData = _phaseDataList.firstWhere(        (phaseData) => phaseData.phase == codedValue.name,      );
      final results = await _utilityNetwork.trace(_traceParameters);      for (final elementTraceResult in results) {        if (elementTraceResult is UtilityElementTraceResult) {          // Get the total customers from the UtilityElementTraceResult.          final distinctIds = elementTraceResult.elements              .map((e) => e.objectId)              .toSet();          phaseData.customers = distinctIds.length;        } else if (elementTraceResult is UtilityFunctionTraceResult) {          // Get the total load from the UtilityFunctionTraceResult.          final functionResult =              elementTraceResult.functionOutputs.first.result as double;          phaseData.load = functionResult;        }      }    }    setState(() => _readyRun = true);  }
  /// Prepares trace parameters for a single phase.  void setUtilityTraceOrConditionWithCodedValue(CodedValue codedValue) {    // Create a conditional expression with the CodedValue.    final phaseAttributeComparison =        UtilityNetworkAttributeComparison.withValue(          networkAttribute: _phasesNetworkAttribute,          comparisonOperator:              UtilityAttributeComparisonOperator.doesNotIncludeAny,          value: codedValue.code,        )!;
    // Chain it with the base condition using an OR operator.    final orCondition = UtilityTraceOrCondition(      leftExpression: _baseCondition,      rightExpression: phaseAttributeComparison,    );    _traceParameters.traceConfiguration?.traversability?.barriers = orCondition;  }
  /// Resets the phase data list to its initial state.  void reset() {    setState(() {      _errorMessage = '';      _readyRun = false;      // Reset each phase data object.      for (final p in _phaseDataList) {        p.customers = 0;        p.load = 0;        p.selected = false;      }    });  }
  /// Sets the error message to display.  void setErrorMessage(String message) {    setState(() {      _errorMessage = message;    });  }
  /// Returns a sorted list of phase data objects.  List<_PhaseData> getPhaseDataList() {    final phaseList =        _phaseCodedValues.map((cv) => _PhaseData(cv.name)).toList()          ..sort((a, b) => a.phase.compareTo(b.phase));    return phaseList;  }}
/// A data class representing phase information.class _PhaseData {  _PhaseData(this.phase);  final String phase;  bool selected = false;  int customers = 0;  double load = 0;}