Clustering groups points into clusters based on their spatial proximity to one another. Clusters can reveal information that is difficult to visualize when there are hundreds or thousands of points in a map that may overlap or cover each other. Adopt clustering if you want to discover patterns in your data, such as:
- Identify where students live in a city so that the local government can plan appropriate educational and accommodation resources. Clustering allows you to visualize this data without revealing the individual student addresses.
- Visualize the most common type of environmental complaints that are registered across a city so that authorities can plan how to deploy their environmental officers.
- Ensure that police units are evenly spread throughout city so that a rapid response time can be maintained for emergency calls from the public.
In the map below, for example, various power plants of north-west Europe are clustered together so that you can easily see the count of power plants in each region. The size of each cluster is proportional to the number of points in each cluster and is recalculated when the map is zoomed.

Clustering can be defined on a point feature layer authored and published using the ArcGIS Online Map Viewer or ArcGIS Pro. If you add a feature layer from an ArcGIS feature service, web map, or mobile map package to your app, any predefined clustering displays automatically.
If the published point feature layer is not enabled with clustering, or if you want to cluster point graphics, you can use this SDK to define clustering by following the steps detailed in Enable clustering. You can enhance the visual representation of the clusters and display summary statistics of the clustered point attributes (not just the number of points) by using a variety of more complex renderers, labels, and pop-ups, as described in Enhanced statistics and renderers.
Enable clustering
To cluster point-based featuresClusteringFeatureReduction object that takes a renderer. The renderer determines the cluster’s color and shape, but the cluster’s size is determined by the number of points in the cluster. So, a cluster with more points is bigger than a cluster with fewer points. You can cluster point features or graphics as follows:
- Create a
SimpleRendererusing aSimpleMarkerSymbol. - Create a
ClusteringFeatureReductionusing the simple renderer. - Pass the
ClusteringFeatureReductionto theFeatureLayer.featureReductionor theGraphicsOverlay.featureReduction.
    final simpleMarkerSymbol = SimpleMarkerSymbol(color: Colors.teal);
    final simpleRenderer = SimpleRenderer(symbol: simpleMarkerSymbol);
    final clusteringFeatureReduction =        ClusteringFeatureReduction(simpleRenderer);
    featureLayer.featureReduction = clusteringFeatureReduction;    // Alternatively, set the feature reduction on the graphics overlay.    // (Note: FeatureReduction instances can't be shared. The line below would result in an    // "object already owned" exception since it's already been applied to the FeatureLayer.)    // graphicsOverlay.featureReduction = clusteringFeatureReduction;
The map below contains a single point symbol for the 8000+ power plants in the United States. On the right side, the points are aggregated into clusters using the default clustering values. Every time the mapview’s viewpoint

Label clusters
The number of points in the cluster is stored in a field called “cluster_count” and is updated every time the cluster redraws. You can display this information in the clusters label, as follows:
- Create a
LabelDefinitionthat uses aSimpleLabelExpressionof “[cluster_count]” and a blackTextSymbol. - Set label definition placement.
- Add the label definition to the
ClusteringFeatureReduction.
    final labelDefinition = LabelDefinition(      labelExpression:          SimpleLabelExpression(simpleExpression: '[cluster_count]'),      textSymbol: TextSymbol(color: Colors.black, size: 15),    );
    labelDefinition.placement = LabelingPlacement.pointCenterCenter;
    clusteringFeatureReduction.labelDefinitions.add(labelDefinition);
The map below shows clusters labeled with a SimpleLabelExpression.

Configure clusters
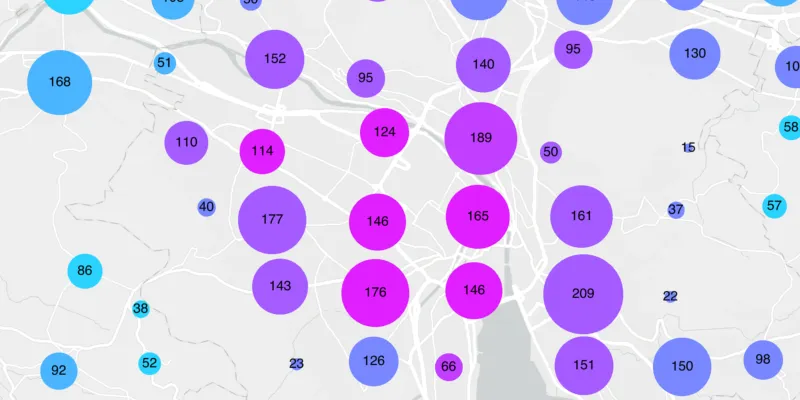
The process of clustering groups points into clusters based on an area of influence defined in screen space by the ClusteringFeatureReduction.radius. This radius has a default value which is 60 device-independent pixels (dpi), but you can set it to a higher value to aggregate points from a larger area or to a lower value to aggregate points from a smaller area. The size of each cluster symbol on the map is proportional to the number of features within the cluster and is recalculated every time the viewpoint
clusteringFeatureReduction.radius = 120;The map below shows points clustered with a clustering radius of 120.

Enhanced statistics and renderers
You can enhance the information displayed to your users by presenting statistical information, such as the average, max, and mode value of the cluster’s point attributes. First, you need to aggregate, or summarize, the cluster’s point data, and then you can:
- Apply advanced renderers, such as class break and unique value renderers.
- Configure labels that use simple or Arcade expressions.
- Design user friendly pop-up text.
Aggregate the point data
First, examine the attributes in your feature layer or graphics overlay and decide which attributes you want to summarize. Next, specify how the attribute values are summarized and store the results in an aggregate field, as follows:
- Create a new
AggregateFieldfor each statistical operation you want to perform on an attribute. Give it aname. - Set the
statisticFieldNameas the attribute (from the feature layer or graphic overlay) you want to analyze. - State the
AggregateStatisticType, such as count, average, mode, and max, that will be applied to thestatisticFieldName. - Add a collection of your aggregate fields to your
ClusteringFeatureReductionso they can be used by its renderer, label, and pop-up definitions.
The code below creates and adds 3 AggregateField objects to the ClusteringFeatureReduction. In the first one, for example, the value of the “fuel1” field that appears most often (mode value) is stored in the “most_common_fuel” aggregate field, the average value of the “capacity_mw” field is stored in the “average_capacity_mw” aggregate field and so on.
clusteringFeatureReduction.aggregateFields.addAll([ AggregateField.withFieldName( name: 'most_common_fuel', statisticFieldName: 'fuel1', statisticType: AggregateStatisticType.mode, ), AggregateField.withFieldName( name: 'average_capacity_mw', statisticFieldName: 'capacity_mw', statisticType: AggregateStatisticType.average, ), AggregateField.withFieldName( name: 'total_capacity_mw', statisticFieldName: 'capacity_mw', statisticType: AggregateStatisticType.sum, ), ]);Apply a class breaks renderer
You can apply a renderer to the cluster to display the value of the aggregate fields. Class breaks renderers are useful if you want to apply different colors to ranges of values. You can apply a class breaks renderer to the cluster as follows:
- For each range of values, create a
ClassBreakand assign aSimpleMarkerSymbolwith a unique color. - Create a
ClassBreaksRendererfor the aggregate field and provide the collection of class breaks. - Pass the class breaks renderer to the constructor of the
ClusteringFeatureReductionand pass that toFeatureLayer.featureReductionorGraphicsOverlay.featureReduction.
    final classBreak1 = ClassBreak(      description: '<5000',      label: '<5000',      minValue: 0,      maxValue: 5000,      symbol: SimpleMarkerSymbol(color: Colors.cyan),      alternateSymbols: [SimpleMarkerSymbol(color: Colors.pink)],    );
    final classBreak2 = ClassBreak(      description: '>5000',      label: '>5000',      minValue: 5001,      maxValue: 10000,      symbol: SimpleMarkerSymbol(color: Colors.greenAccent),      alternateSymbols: [SimpleMarkerSymbol(color: Colors.pink)],    );
    final classBreak3 = ClassBreak(      description: '>10000',      label: '>10000',      minValue: 10001,      maxValue: 15000,      symbol: SimpleMarkerSymbol(color: Colors.green),      alternateSymbols: [SimpleMarkerSymbol(color: Colors.pink)],    );
    final classBreak4 = ClassBreak(      description: '>15000',      label: '>15000',      minValue: 15001,      maxValue: 50000,      symbol: SimpleMarkerSymbol(color: Colors.orange),      alternateSymbols: [SimpleMarkerSymbol(color: Colors.pink)],    );
    final classBreak5 = ClassBreak(      description: '>50000',      label: '>50000',      minValue: 50001,      maxValue: 1000000,      symbol: SimpleMarkerSymbol(color: Colors.red),      alternateSymbols: [SimpleMarkerSymbol(color: Colors.pink)],    );
The map below shows the clusters rendered with a class breaks renderer and reflects the range of total_capacity_mw values. For example, the red color indicates that the sum of the capacity_mw of all the points in a cluster is greater than 50000 MW.

Configure label expressions
As shown previously, you can label each cluster with the number of points in the cluster. However, now that you have created some aggregate fields, you can use these to label the clusters by configuring a SimpleLabelExpression or an ArcadeLabelExpression.
In the map below, the most_common_fuel aggregate field value of each cluster is displayed in a label by using a SimpleLabelExpression.
    final clusteringFeatureReduction =        ClusteringFeatureReduction(classBreaksRenderer);
    final commonFuelLabelExpression =        SimpleLabelExpression(simpleExpression: '[most_common_fuel]');
In the map below, the total_capacity_mw aggregate field value of each cluster is reformated, concatenated with the “MW”, and displayed in a label by using an ArcadeLabelExpression.
final labelExpression = ArcadeLabelExpression( arcadeString: "Concatenate([Text(\$feature.total_capacity_mw, '###,###') + ' MW'])", );
Configure pop-up expressions
You can configure your app to display a pop-up when the user clicks on a cluster. By default, the cluster’s pop-up displays its “point_count” value; the number of points in the cluster. If the ClusteringFeatureReduction has aggregate fields, the cluster pop-up will display the aggregate field values. However, if you want to present a more user-friendly text, you can create an Arcade expression, as follows:
- Create a
PopupDefinitionusing theClusteringFeatureReduction. - Assign the pop-up definition to the clustering feature reduction.
- Specify a title and remove all elements from the pop-up definition.
- Create a
PopupExpression, provide an Arcade expression, and specify that the return type is string. In this example, the Arcade expression reformats and concatenates a few aggregate fields representing the average and total capacities, along with some helpful text. - Create an
ExpressionPopupElementusing the pop-up expression. - Add the expression pop-up element to the pop-up definition’s collection of elements.
final popupDefinition = PopupDefinition.withPopupSource(clusteringFeatureReduction);
clusteringFeatureReduction.popupDefinition = popupDefinition; clusteringFeatureReduction.popupDefinition?.title = 'Cluster Summary'; clusteringFeatureReduction.popupDefinition?.elements.clear();
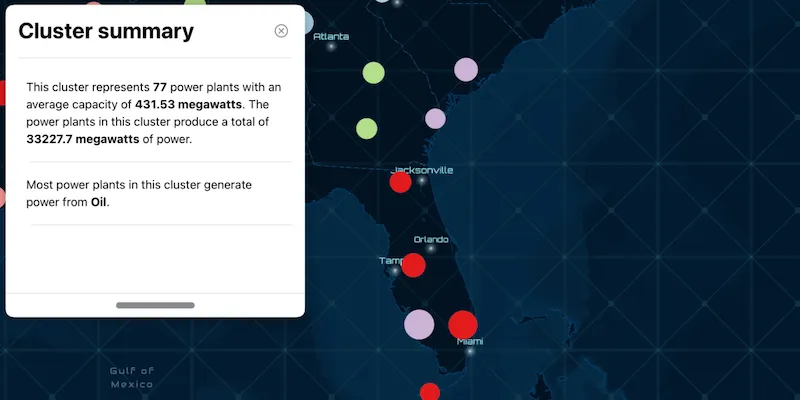
final popupExpression1 = PopupExpression(); popupExpression1.expression = '''var result = Concatenate(['The power plants in this cluster have an average capacity of ' + Text(\$feature.average_capacity_mw, '#.00') + ' megawatts and produce a total of ' + Text(\$feature.total_capacity_mw, '###,###.00') + ' megawatts of power.']);return { type : 'text', text : result };'''; popupExpression1.returnType = PopupExpressionReturnType.string;
final expressionPopupElement1 = ExpressionPopupElement(popupExpression: popupExpression1);
final popupExpression2 = PopupExpression(); popupExpression2.expression = '''var result = Concatenate(['Most power plants in this cluster generate power from ' + \$feature.most_common_fuel + '.']);return { type : 'text', text : result };'''; popupExpression2.returnType = PopupExpressionReturnType.string;
final expressionPopupElement2 = ExpressionPopupElement(popupExpression: popupExpression2);
clusteringFeatureReduction.popupDefinition?.elements .addAll([expressionPopupElement1, expressionPopupElement2]);The map below shows a pop-up configured with a PopupExpression.

For more information about how to add pop-ups to your app, see the PopupView component and example code that is provided by the ArcGIS Maps SDK for Flutter Toolkit.
Explore a cluster
Each cluster of points is an aggregation of geoelements called an AggregateGeoElement. If you want to find out which geoelementsAggregateGeoElement.getGeoElements(). You can then iterate through the collection to display individual geoelement attribute values, for example.
    // Get the selected cluster and obtain its collection of geoelements.    if (aggregateGeoElement.isSelected) {      final geoElements = await aggregateGeoElement.getGeoElements();
      if (geoElements.isEmpty) return;
      // If you have mix of feature layers and graphics overlays in your map,      // check for the type of geoelement to be a feature or graphic, for example.      for (final geoElement in geoElements) {        if (geoElement is Feature) {          final geoElementName = geoElement.attributes['name'] as String;
          debugPrint(geoElementName);        }      }    }