A symbol
A renderer
Some layer types don’t support symbols
Symbols
For features
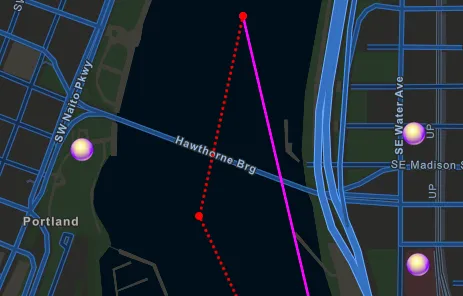
The following symbols
-
Simple symbols follow the web map specification. You can create these using the simple symbology API, or get them from web maps and feature services when advanced symbology is turned off.
-
Advanced symbols follow the ArcGIS Pro symbol model. You can create these using the multilayer symbol classes, or get them from feature services, mobile style files, dictionary renderers, and mobile map packages.
When authoring maps in ArcGIS Pro
You should use advanced symbols
The following example creates a SimpleFillSymbol that uses a SimpleLineSymbol to define its outline:
// Create a solid while line symbol.final simpleLineSymbol = SimpleLineSymbol(  style: SimpleLineSymbolStyle.solid,  color: Colors.white,  width: 2.0,);
// Create a solid red fill symbol with a white outline.final simpleFillSymbol = SimpleFillSymbol(  style: SimpleFillSymbolStyle.solid,  color: Colors.red,  outline: simpleLineSymbol,);
The following code creates a SimpleMarkerSceneSymbol to define a 3D symbol for display in a ArcGISScene:
// Create an orange cone where the bottom of the// symbol is the anchor point.final pointSymbol = SimpleMarkerSceneSymbol( style: SimpleMarkerSceneSymbolStyle.cone, color: Colors.orange, height: 15, width: 15, depth: 15, anchorPosition: SceneSymbolAnchorPosition.bottom,);Renderers
A renderer
Renderers are used to symbolize feature or raster layers, since symbols cannot be applied directly to that data. A rendererFieldAnalysis to visualize dynamic analysis results in an AnalysisOverlay.
Renderers
Feature layers and graphics overlays
The following are the types of renderers available for feature layers and graphics overlays:
-
SimpleRenderer— A simple rendererA simple renderer is a renderer that defines a single symbol used to display all features in a layer. displays all features in a layer or graphics overlayA graphics overlay is a client-side, temporary container of graphics to display on a map view or scene view. using the same symbol. For example, display all points in the world cities layer as a small red square. -
UniqueValueRenderer— Applies a unique symbol for each specified value of an attribute (or combination of attributes). A unique value rendererA unique value renderer is a renderer that defines a distinct symbol for each unique data value returned from a field or expression in a layer. can be based on any data type but is typically used with string attributes. For example, display points in the world cities layer using two symbols: a small gray triangle for features with a value ofNfor theCAPITALattribute and a large yellow star for those with a value ofY. -
ClassBreaksRenderer— Symbolizes features or graphics according to specific ranges of values for an attribute. The attribute used for a class breaks rendererA class breaks renderer is a renderer that classifies numeric data into two or more ranges of values to create a visualization. Each class (or range) is defined by a lower and an upper value and a unique symbol. must be numeric. For example, display world cityPOPULATIONvalue with three different symbols based on size range: a small blue circle for cities with a value between0and100000, a slightly larger blue circle for cities with a value between100001and2999999, and a larger blue circle for cities with a value over3000000. -
DictionaryRenderer— Renders features or graphics by constructing multilayer symbols from a style fileA style file is a and associated attribute values. A dictionary renderer.stylxfile created in ArcGIS Pro that contains symbol primitives, such as the symbol frame, lines that make up inner icons.A dictionary renderer is a renderer that uses a style file generated in ArcGIS Pro from a rule engine and is used to display types of advanced symbology on a map, such as military symbology. is commonly used to display military symbology. See the Display symbols with a dictionary renderer topic for details.
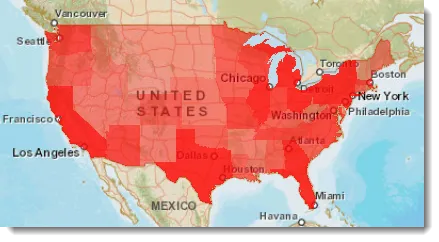
The following image shows a layer with a class breaks renderer. The renderer displays features as five classes of population, each with a different symbol (a darker or lighter shade of red).
A SimpleRenderer that uses a SimpleMarkerSymbol for displaying all features. This renderer could be applied to a FeatureLayer or GraphicsOverlay:
// Create a simple renderer using a simple marker symbol.final renderer = SimpleRenderer( symbol: SimpleMarkerSymbol( style: SimpleMarkerSymbolStyle.circle, color: Colors.teal, size: 12, ),);Raster layers
The following raster renderers are available to control how raster
-
HillshadeRenderer— Renders elevation data as shaded relief in grayscale, using a hypothetical sun position to calculate light and shadow. Use this renderer with single-band elevation rasterA raster is a matrix of cells (or pixels) organized into rows and columns (or a grid) where each cell contains a value representing information, such as temperature. Rasters include digital aerial photographs, imagery from satellites, digital pictures, and scanned maps. data in a raster layerA raster layer is a layer type that allows developers to display raster data in their applications. when you want to reveal terrain shape and depth. Common uses include DEM visualization, terrain context layers, and cartographic relief effects. -
BlendRenderer— Applies aColorRampand blends it with hillshade to emphasize high and low elevation while preserving terrain relief. UsePresetColorRampTypefor common elevation, surface, temperature, precipitation, or bathymetry visualizations, or use custom color ramps when specific value ranges need emphasis. -
ColormapRenderer— Maps discrete cell values to specific colors. Use this renderer for classified or thematic rasters where each category code needs a defined color. Common uses include land cover classes, suitability classes, risk zones, masks, and other integer rasters. A colormap can also support interactive workflows where category colors are updated dynamically. -
StretchRenderer— Stretches continuous raster values to improve visual contrast. Use this renderer with aColorRampwhen source values are concentrated in a narrow range or when you want to reveal continuous patterns with a meaningful gradient. Common uses include satellite imagery, grayscale band display, elevation rasters, temperature rasters, and other continuous surfaces. -
RgbRenderer— Combines selected raster bands into red, green, and blue channels. Use this renderer for multiband rasters when creating true-color or false-color composites. Common uses include natural color imagery, near-infrared composites, and vegetation-focused visual analysis.
Raster renderers often use either a ColorRamp or a Colormap, depending on the type of values being displayed. For continuous raster data or continuous field analysis results, such as elevation, temperature, precipitation, or bathymetry, use a ColorRamp with a StretchRenderer or BlendRenderer to display values with a smooth gradient. Use PresetColorRampType for common visualization patterns. This includes ramps designed for accessibility, including ramps from the cividis color ramp family that are designed to be more accessible for users with color vision deficiencies. When preset ramps don’t provide enough control, create a custom ColorRamp from a list of colors or weighted ColorStops to control how values transition across the range.
For discrete or classified raster data, such as land cover, suitability classes, or masks, use a ColormapRenderer with a Colormap that maps each raster cell value to a specific color. The same approach can be used for discrete or boolean field analysis results, for example, to symbolize true and false values from a BooleanFieldFunction with distinct colors in a FieldAnalysis. This approach is useful when categories must remain visually distinct or when an app needs to let users change category colors at run time.
When rendering a raster layer, also choose a resampling method that matches the type of data. The RasterLayer.resamplingType property controls how raster cell values are calculated when the layer is displayed at a different resolution or transformed. Use nearest-neighbor resampling for discrete or boolean data to preserve category values, and bilinear interpolation for continuous data to create smoother transitions between values. The default automatic setting generally selects the appropriate method based on the raster’s properties, but explicitly set the property when the data type cannot be inferred, such as for a raster exported from a continuous or discrete field analysis result.
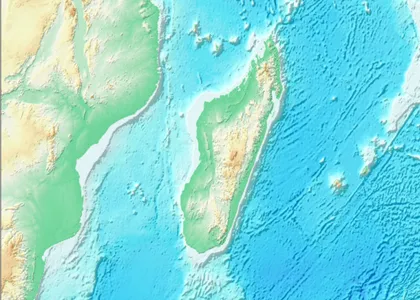
The following image shows a rendered raster of Madagascar using a hillshade renderer to show terrain relief with light and shadow.
The following code applies a ColormapRenderer to a raster layer created from the result of a map algebra calculation using the spatial analysis APIs. The full example categorizes elevation values into geomorphic classes, exports the classified result to a raster, and then uses a colormap to assign a distinct color to each class before adding the layer to the map:
// Define a renderer for the different geomorphic categories.final colors = {  1: Colors.blue.shade600, // Raised shoreline.  2: Colors.teal.shade200, // Ice covered.  3: Colors.brown, // Ice-free high ground.};
// Create a colormap renderer using the defined categories.final colormap = Colormap.fromValuesAndColors(colors);final colormapRenderer = ColormapRenderer.withColormap(colormap);
// Set the colormap renderer to the results raster layer and apply an opacity.resultsRasterLayer!.renderer = colormapRenderer;resultsRasterLayer!.opacity = 0.5;
// Add the results raster layer to the map.mapViewController.arcGISMap!.operationalLayers.add(resultsRasterLayer!);Styles
Layers can also be rendered using a style. Styles are containers that can store symbols, colors, and several other types of information used for rendering a layer. They promote consistency and standardization across your maps and scenes by defining a common set of symbology that can be shared between projects. In fact, the symbol galleries and color pickers you use when authoring maps and scenes in ArcGIS Pro or the ArcGIS Online Map Viewer are populated using styles. See the ArcGIS Pro Styles documentation for more information and a description of the types of styles.
Mobile style files
Mobile style files are one of several style types you can create in ArcGIS Pro. They let you apply symbol styles using a .stylx file that’s local to the device. This local file enables you to maintain style and branding consistency even when users are offline. Access symbols from the mobile style file using the SymbolStyle class.
// Create parks and trails feature layers from their service feature tables.final parksServiceFeatureTable = ServiceFeatureTable.withUri(  Uri.parse(    'https://services3.arcgis.com/GVgbJbqm8hXASVYi/arcgis/rest/services/Parks_and_Open_Space/FeatureServer/0',  ),);final parksFeatureLayer =    FeatureLayer.withFeatureTable(parksServiceFeatureTable);
final trailsServiceFeatureTable = ServiceFeatureTable.withUri(  Uri.parse(    'https://services3.arcgis.com/GVgbJbqm8hXASVYi/arcgis/rest/services/Trails/FeatureServer/0',  ),);final trailsFeatureLayer =    FeatureLayer.withFeatureTable(trailsServiceFeatureTable);
// Open a mobile style from a .stylx file.final mobileStyle = SymbolStyle.withFileUri(mobileStyleFile.uri);
// Load the mobile style file before requesting symbols from it.await mobileStyle.load();
// Get multilayer symbols from FireflyMobile.stylx using a list of one or more// symbol identifiers (keys).final parksSymbol = await mobileStyle.getSymbol(['FireflyPoly_8']);final trailsSymbol = await mobileStyle.getSymbol(['FireflyLine_5']);
// Set the layer renderers to use the appropriate symbol from the mobile style.parksFeatureLayer.renderer = SimpleRenderer(symbol: parksSymbol);trailsFeatureLayer.renderer = SimpleRenderer(symbol: trailsSymbol);
Not all capabilities of ArcGIS Pro style files are supported in the mobile style file. The limitations are described in the Mobile styles section on the ArcGIS Pro Style page. For details on creating and applying a mobile style file, see the Create a mobile style for native apps blog.
ArcGIS vector tile layer styles
An ArcGIS vector tile layer
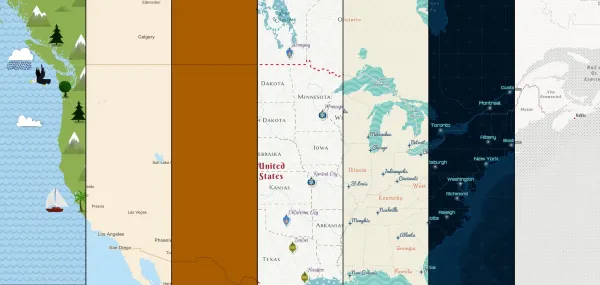
You can create your own style with the ArcGIS Vector Tile Style Editor. Your customized vector layers can then be saved to and read from ArcGIS Online.
WMS styles
A WMS
WMS servers provide clients with a list of supported styles for each layer. At run time, you can choose the style the WMS server uses to render map images. In general, styles are predefined and cannot be changed or added to.
The styles defined in the layer information can be inspected to determine the styles (if any) that are available. The style of a WMS