▾
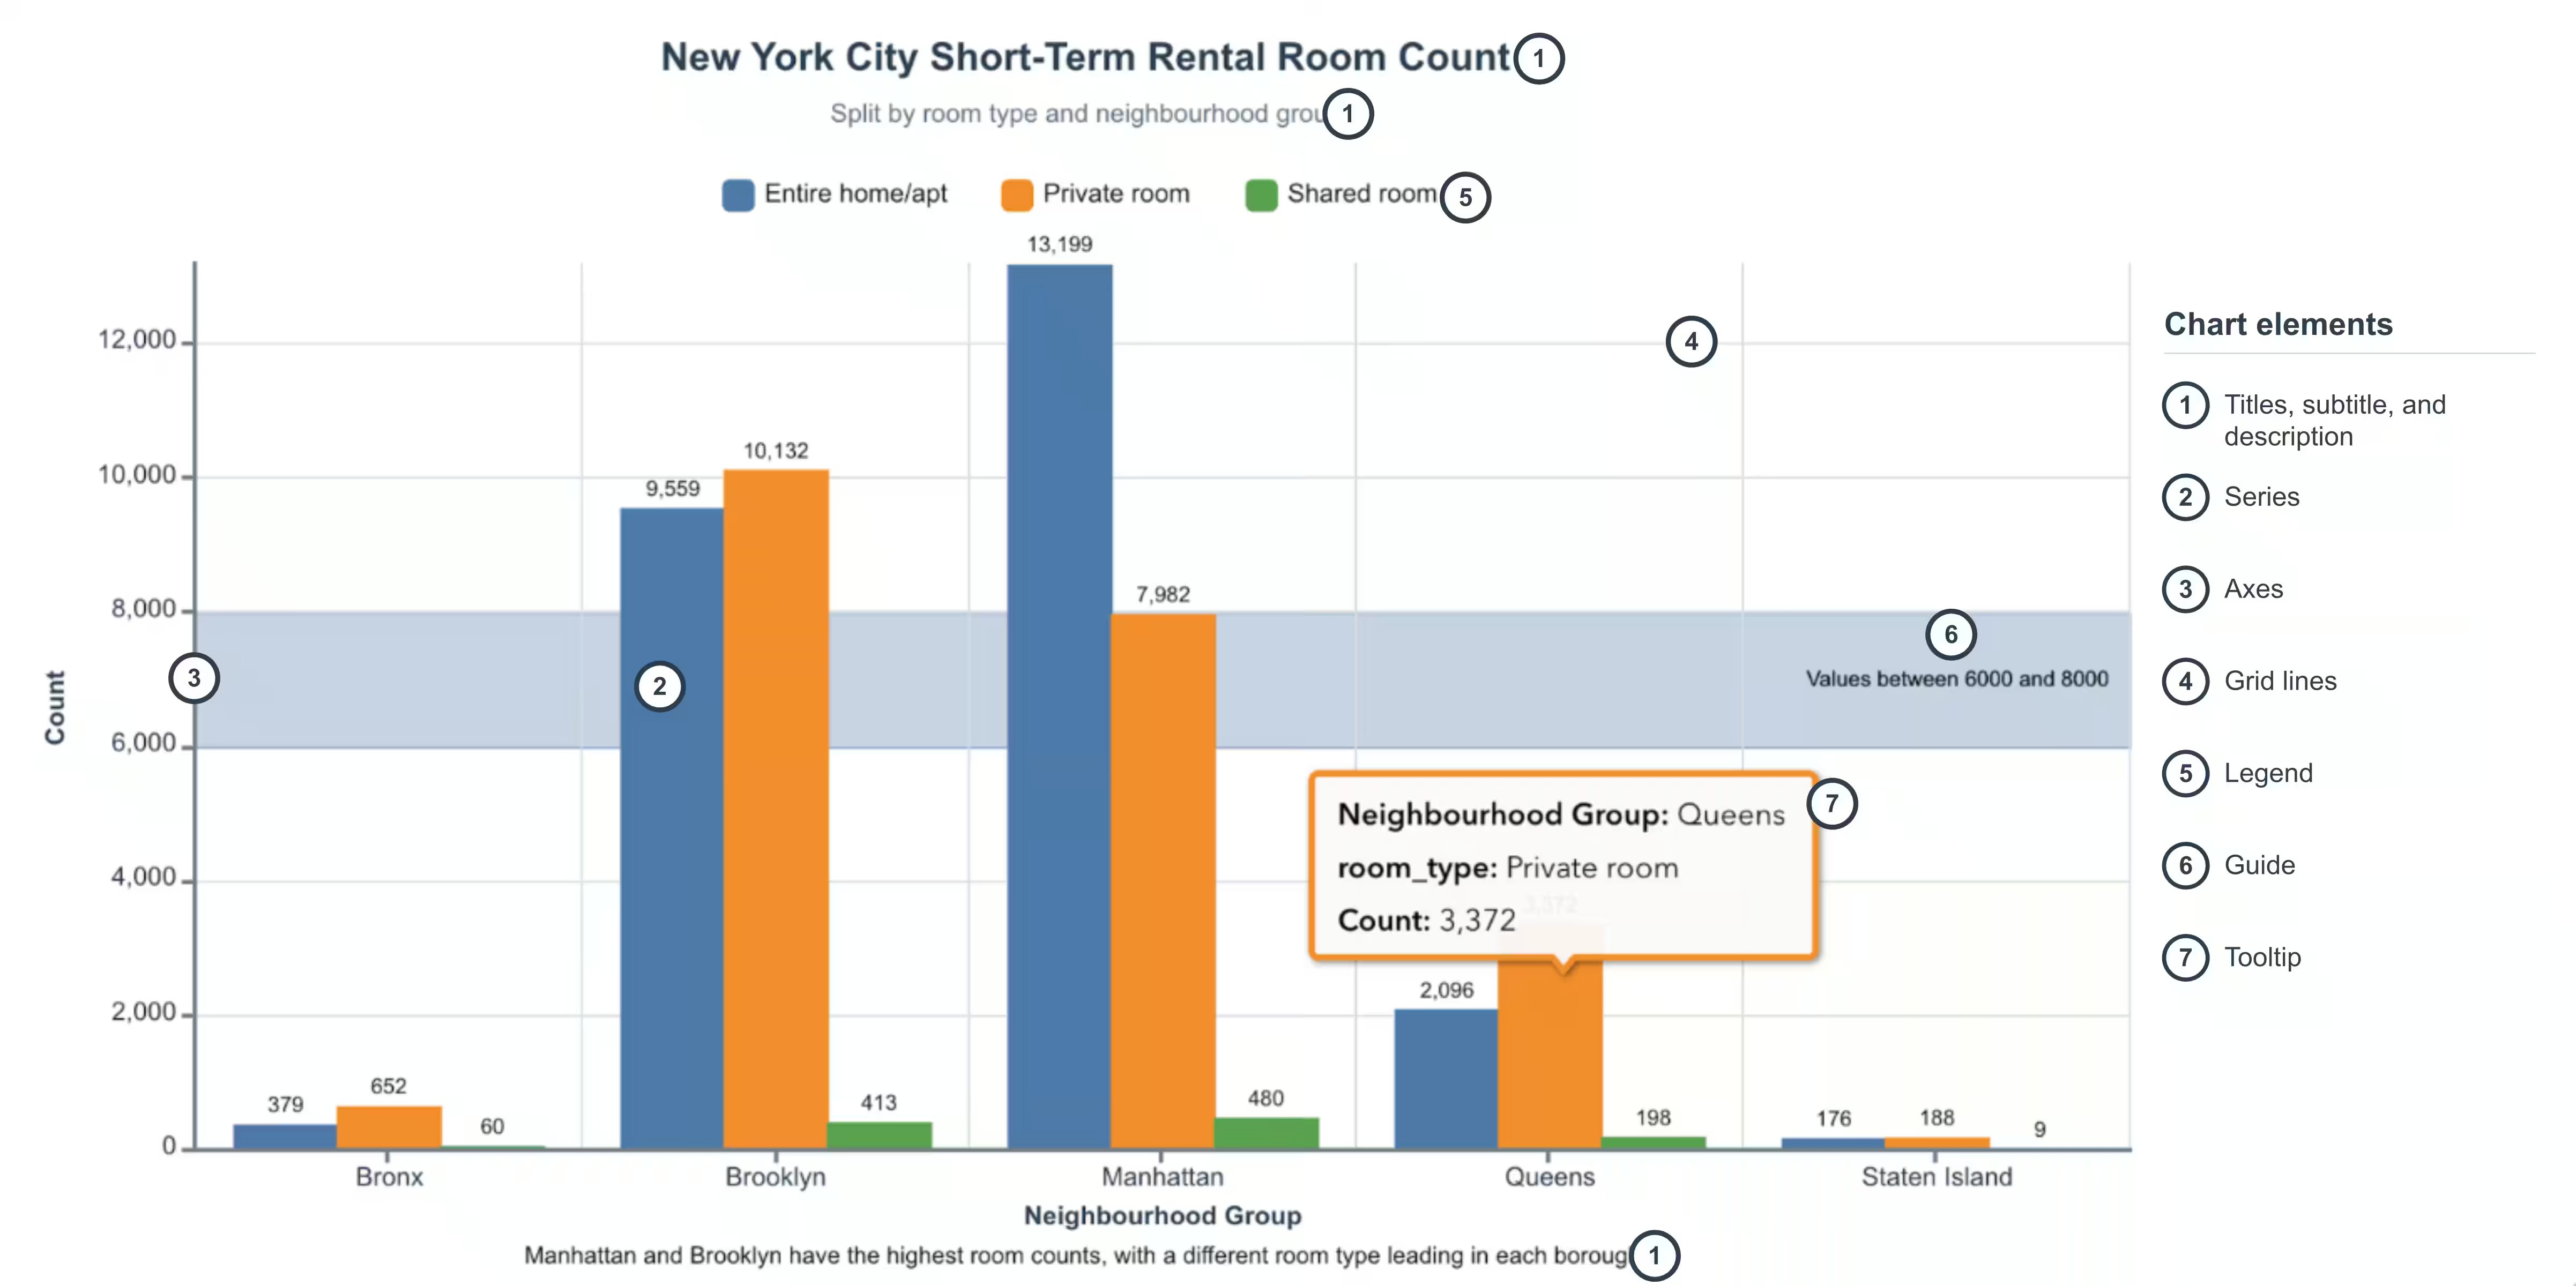
Charts use visual elements to organize data and make it easier to understand. While elements vary by chart type, many charts share titles, series, axes, legends, guides, data labels, and tooltips. This guide highlights some of the core customization for each of the chart elements.
Titles, subtitles, and descriptions
The title identifies the chart’s subject, the subtitle adds context, and the description explains the chart’s main takeaway.
Set their text with the titleText, subtitleText, and descriptionText properties.
The visibility of these elements can be controlled individually using the corresponding visibility properties, such as chartTitleVisibility for the title, chartSubtitleVisibility for the subtitle, and descriptionVisibility for the description.
Series
Depending on the chart type, series represent data as bars, lines, slices, boxes, markers, or cells. Series names, visibility, and other properties can be customized to control how each series appears in the chart via model methods and properties.
Axes
Axes are the reference lines along the side and bottom of the chart that provide a scale for interpreting the data values. Typically, the x-axis refers to the horizontal axis, and the y-axis refers to the vertical axis. When the chart is rotated, the roles of the axes are reversed.
A secondary y-axis can be added to combo bar line chart to display an additional set of values with a different scale. Refer to the With two y-axes guide for more details.
Axis bounds
By default, axis bounds containing numeric values fit the data’s minimum and maximum values.
To adjust how values appear along an axis, you can:
- Add padding beyond the data range with
setBuffer. - Zoom and navigate through a portion of the axis with
setAxisScrollbar. - Represent values across several orders of magnitude with a logarithmic scale using
setLogarithmic.
Axis labels
Axes labels can be customized by setting the setHorizontalAxisLabelsBehavior and setVerticalAxisLabelsBehavior model methods.
Labels can be hidden, rotated, staggered or wrapped to improve readability and presentation of the chart.
The axes label’s value can also be customized by using the xAxisLabelFormatter, yAxisLabelFormatter, and secondaryYAxisLabelFormatter properties on the chart component.
Grid lines
Grid lines extend across the chart area to help readers compare data values against the axis scale.
By default, bar, line, combo bar line, box plot, and histogram charts show only horizontal grid lines, while scatterplots show both horizontal and vertical grid lines.
Legend
When a chart contains multiple series, legends will be displayed automatically to help readers identify which visual encodings correspond to each series.
Customize legend behavior and layout with these properties:
- Clicking a legend item hides its corresponding series. Set
legendInteractionsDisabledon the chart component to disable this behavior. - Customize the value shown for a legend item with the chart component’s
legendValueLabelFormatterproperty. - Position the legend at the top, bottom, left, or right of the chart with the charts model’s
legendPositionproperty. - Set the legend’s maximum height with the charts model’s
legendMaxHeightproperty.
Guides
In charts with axes, guides mark a value or range to highlight thresholds, targets, or other values of interest.
Use the charts model’s setGuideStart, setGuideEnd, setGuideName, and setGuideVisibility methods to configure a guide.
The guide’s tooltip values can be customized by using the guideTooltipFormatter property on the chart component.
Tooltips
Tooltips show details about a series’ data point when hovered over. Tooltips can contain different data values base on the chart type. This can be configured to display additional information by using the tooltipFormatter property on the chart component.
Use the chart model’s setDataTooltipValueFormat method to format tooltip values and setDataTooltipVisibility to control whether data tooltips are displayed.