<meta name="viewport" content="width=device-width, initial-scale=1, shrink-to-fit=no" />
<title>Custom ElevationLayer - Thematic data as elevation | Sample | ArcGIS Maps SDK for JavaScript</title>
<link rel="stylesheet" href="https://js.arcgis.com/5.1/esri/themes/light/main.css" />
--calcite-label-margin-bottom: 1rem;
margin: 10px 10px 0 10px;
calcite-label:last-child {
--calcite-list-border-color: rgba(255, 0, 0, 0);
<!-- Load the ArcGIS Maps SDK for JavaScript from CDN -->
<script type="module" src="https://js.arcgis.com/5.1/"></script>
] = await $arcgis.import([
"@arcgis/core/Graphic.js",
"@arcgis/core/layers/GraphicsLayer.js",
"@arcgis/core/geometry/Extent.js",
"@arcgis/core/layers/BaseElevationLayer.js",
"@arcgis/core/layers/BaseTileLayer.js",
"@arcgis/core/layers/ImageryLayer.js",
"@arcgis/core/layers/support/RasterFunction.js",
"@arcgis/core/layers/support/DimensionalDefinition.js",
"@arcgis/core/layers/support/MosaicRule.js",
"@arcgis/core/request.js",
"@arcgis/core/core/reactiveUtils.js",
/***********************************
* Setup the Scene component
***********************************/
const viewElement = document.querySelector("arcgis-scene");
let selectedDepth = -100;
let selectedDate = 1400371200000;
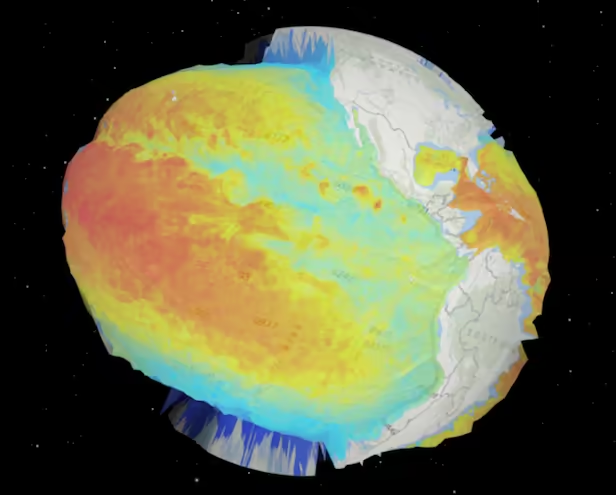
// Add the Temperature3DLayer as an elevation layer to the scene
// with a 2D ImageryLayer representing elevation draped on top
viewElement.map = new Map({
layers: [createTemperature3DLayer(selectedDepth, selectedDate)],
layers: [createTemperature2DLayer(selectedDepth, selectedDate)],
position: { x: 36004541, y: -8073308, z: 10249365, spatialReference: { wkid: 102100 } },
viewElement.constraints = { altitude: { max: 38226000 } };
await viewElement.viewOnReady();
// Initial setup and filters
createTemperatureZFilter(selectedTemp);
createTemperatureLegend();
/***********************************
* Get a reference to the HTML elements
***********************************/
const depthSlider = document.getElementById("depth-slider");
const datePicker = document.getElementById("date-picker");
const tempSlider = document.getElementById("temp-slider");
const loader = document.getElementById("loader");
/***********************************
* Event listeners for the filters control panel
***********************************/
depthSlider.addEventListener("calciteSliderChange", (event) => {
selectedDepth = parseInt(event.target.value);
datePicker.addEventListener("calciteInputDatePickerChange", (event) => {
const value = event.target.value;
const [year, month, day] = value.split("-").map(Number);
selectedDate = Date.UTC(year, month - 1, day);
tempSlider.addEventListener("calciteSliderInput", (event) => {
selectedTemp = parseInt(event.target.value);
createTemperatureZFilter(selectedTemp);
/***********************************
* Update the elevation layer and operational layers to reflect temperature
* at the indicated by the selected depth and date
***********************************/
async function updateLayer() {
loader.style.display = "flex";
// Access the view from the component
const view = viewElement.view;
viewElement.map.ground.layers.removeAll();
viewElement.map.ground.layers.add(createTemperature3DLayer(selectedDepth, selectedDate));
const oldLayer = viewElement.map.layers.find((layer) => layer.title === "Sea Temperature");
if (oldLayer) viewElement.map.remove(oldLayer);
viewElement.map.add(createTemperature2DLayer(selectedDepth, selectedDate));
* Wait until the view is ready after the update
* Trick: wait until the 'updating' becomes true (loading started)
* and then it comes back to false (loading ended)
await reactiveUtils.whenOnce(() => view.updating === true);
await reactiveUtils.whenOnce(() => view.updating === false);
// Hide the loader only when everything has been rendered
loader.style.display = "none";
// --------------------------------------------------------------------
// --------------------------------------------------------------------
// Creates a new ImageryLayer representing temperature data for the given depth on that date
function createTemperatureLayer(depth, date, format) {
return new ImageryLayer({
url: "https://sampleserver6.arcgisonline.com/arcgis/rest/services/ScientificData/SeaTemperature/ImageServer",
rasterFunction: new RasterFunction({ functionName: "None" }),
mosaicRule: new MosaicRule({
multidimensionalDefinition: [
new DimensionalDefinition({
variableName: "water_temp",
new DimensionalDefinition({
variableName: "water_temp",
dimensionName: "StdTime",
// Create a subclass of BaseElevationLayer where elevations will represent temperatures
function createTemperature3DLayer(depth, date) {
const LayerClass = BaseElevationLayer.createSubclass({
// Exaggerates the temperatures by 80000x so we can see the variation at large scales
properties: { factor: 80000, depth: null, date: null },
this._temperature = createTemperatureLayer(this.depth, this.date, "lerc");
this.addResolvingPromise(this._temperature.load());
// This function must associate elevation tiles with temperature
// values. This is achieved by getting the bounds (or extent)
// of the tile and fetching a temperature image based on
fetchTile: function (level, row, col, options) {
const bounds = this.getTileBounds(level, row, col);
const tileSize = this.tileInfo.size[0] + 1;
const extent = new Extent({
spatialReference: this.spatialReference,
const factor = this.factor;
if (options.signal?.aborted) return Promise.reject(new Error("aborted"));
// Fetch the pixels representing temperature for the extent of the tile.
// This method returns the pixel data of the image for the extent
// of the given elevation tile
return this._temperature.fetchPixels(extent, tileSize, tileSize, options).then((data) => {
if (options.signal?.aborted) throw new Error("aborted");
const pixelBlock = data.pixelBlock;
// Contains the temperature values of each pixel in the image
const elevations = pixelBlock.pixels[0];
const stats = pixelBlock.statistics?.[0];
// Pixels that don't contain any temperature values
const noDataValue = stats.noDataValue;
elevations.forEach((value, index, pixelData) => {
// Multiply temperatures by the given factor.
// Areas with no temperature data (land) will be assigned the average sea surface temperature (17 degrees Celsius)
pixelData[index] = value !== noDataValue ? value * factor : 17 * factor;
// Return the modified temperatures as elevations
height: pixelBlock.height,
noDataValue: noDataValue,
return new LayerClass({ depth, date });
// Create a subclass of BaseTileLayer. This layer will create a tiled version of ImageryLayer that draws faster on the client
function createTemperature2DLayer(depth, date) {
const LayerClass = BaseTileLayer.createSubclass({
properties: { title: "Sea Temperature", opacity: 0.6, depth: null, date: null },
// Load ImageryLayer containing temperature values
this._temperature = createTemperatureLayer(this.depth, this.date, "jpgpng");
this.addResolvingPromise(this._temperature.load());
fetchTile: function (level, row, col, options) {
const bounds = this.getTileBounds(level, row, col);
const tileSize = this.tileInfo.size[0];
const extent = new Extent({
spatialReference: this.spatialReference,
if (options.signal?.aborted) return Promise.reject(new Error("aborted"));
// Fetch the image representing temperature for the extent of the tile.
// this method returns the pixel data of the image for the extent
// of the given elevation tile
.fetchPixels(extent, tileSize, tileSize, { ...options, applyRendering: true })
if (options.signal?.aborted) throw new Error("aborted");
const pixelBlock = data.pixelBlock;
// The service gives back pixels color values as the format set on the layer is jpgpng
const [r, g, b] = pixelBlock.pixels;
// Mask tells when there is data or not
const mask = pixelBlock.mask;
// Create a canvas of the size of the tile and colorizes the tile with the pixel color values
const canvas = document.createElement("canvas");
canvas.width = canvas.height = tileSize;
const context = canvas.getContext("2d");
const imageData = context.getImageData(0, 0, tileSize, tileSize);
const pixels = imageData.data;
// Loop through the pixels in the image data, which are the pixels
// of the image that will be displayed.
// `pixels` is a flat array of color values and alpha [r, g, b, a, r, g, b, a, ...]
// The length of the pixels array is then the number of pixels times 4.
// Since we have 3 distinct arrays for r, g, b in the pixelBlock
// we need to iterate through the pixels and through the color values respectively
// So we decide to have 2 indexes: i and j
for (let i = 0, j = 0; i < pixels.length; i += 4, j++) {
// Time to put the image data on the canvas
context.putImageData(imageData, 0, 0);
return new LayerClass({ depth, date });
// Creates a graphic at the extent of the world
// used to filter out elevations (temperatures)
// below a specified value
function createTemperatureZFilter(temp) {
const layerTitle = "Temperature filter";
const filterGraphic = new Graphic({
symbol: { type: "simple-fill", color: [255, 255, 255, 0.7], outline: null },
const existingLayer = viewElement.map.layers.find((l) => l.title === layerTitle);
const layer = new GraphicsLayer({
graphics: [filterGraphic],
elevationInfo: { mode: "absolute-height", offset: 4500 },
viewElement.map.layers.add(layer);
existingLayer.graphics = [filterGraphic];
// Request the legend directly from the service since
// custom layers aren't supported by the Legend component
function createTemperatureLegend() {
"https://sampleserver6.arcgisonline.com/arcgis/rest/services/ScientificData/SeaTemperature/ImageServer/legend";
const legendParts = response.data.layers[0].legend;
const maxImgSrc = "data:" + legendParts[0].contentType + ";base64," + legendParts[0].imageData;
const minImgSrc = "data:" + legendParts[2].contentType + ";base64," + legendParts[1].imageData;
const legendList = document.getElementById("legend-list");
legendList.innerHTML = "";
const addItem = (part, src) => {
const listItem = document.createElement("calcite-list-item");
listItem.label = part.label;
const img = document.createElement("img");
img.slot = "content-start";
img.style.width = "20px";
img.style.height = "20px";
listItem.appendChild(img);
legendList.appendChild(listItem);
if (legendParts[0]) addItem(legendParts[0], maxImgSrc);
if (legendParts[2]) addItem(legendParts[2], minImgSrc);
.catch((error) => console.error("Legend error: ", error));
<arcgis-scene viewing-mode="local">
<arcgis-zoom slot="top-left"></arcgis-zoom>
<arcgis-navigation-toggle slot="top-left"></arcgis-navigation-toggle>
<arcgis-compass slot="top-left"></arcgis-compass>
<calcite-card slot="top-right" id="controls-card">
Sea temperature at (meters)
<calcite-input-date-picker id="date-picker" value="2014-05-18" min="2014-04-07" max="2014-06-26">
</calcite-input-date-picker>
Hide temperatures below (°C)
<calcite-card slot="bottom-left" id="legend-card">
<div slot="heading">Sea Temperature (°C)</div>
<calcite-list id="legend-list" interaction-mode="static"></calcite-list>
<calcite-loader id="loader" text="Updating..." type="indeterminate" slot="bottom-right" scale="s">