Create a scale-dependent visualization

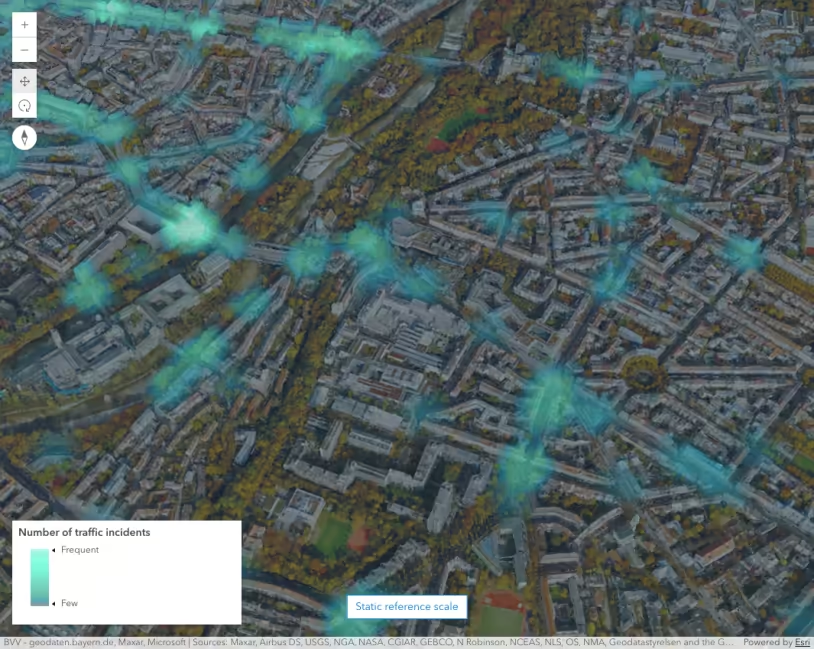
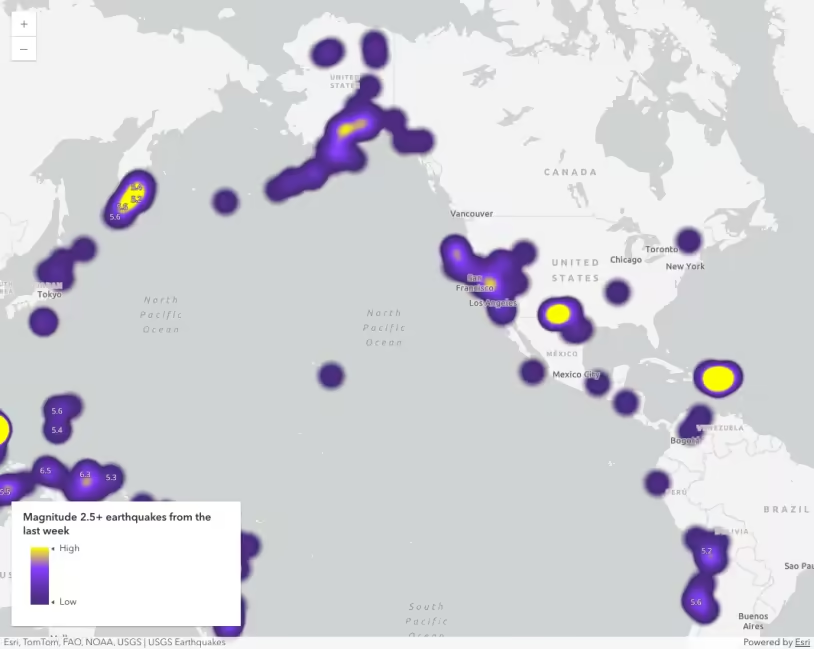
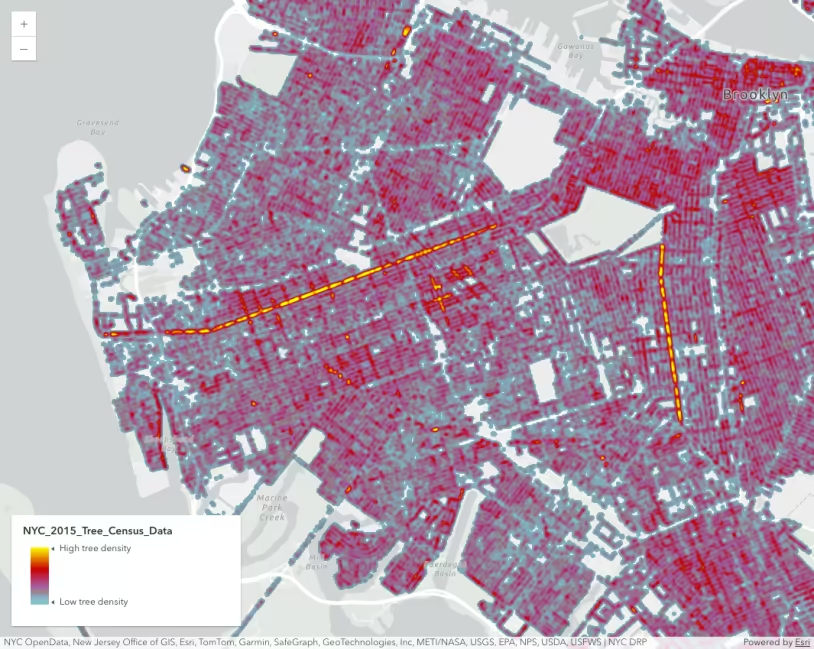
This sample demonstrates how to create a scale-dependent visualization with a HeatmapRenderer and a SimpleRenderer.

A HeatmapRenderer is ideal for visualizing large, dense point datasets, particularly those that have lots of overlapping points. However, the heatmap is only effective at certain scales. It particularly tends to fail to convey useful information at large scales.

You can setup a watch on the view's scale property and set a scale threshold where the layer's renderer can switch from a heatmap to discrete marker symbols as the user zooms to large scales.

Use dark colors for code blocksCopy
1
2
3
4
5
6
7
8
9
10
11
12
13
14
15
16
17
18
19
20
21
22
23
24
25
26
27
28
29
30
31
32
33
34
35
36
37
38
39
40
41
42
43
44
45
46
47
48
49
50
51
52
53
54
55
56
57
58
59
60
61
62
63
64
65
66
67
68
69
70
71
72
73
74
75
76
77
78
79
80
81
82
83
84
85
86
87
88
89
90
91
92
93
94
95
96
97
98
99
100
101
102
103
104
105
106
107
108
109
110
111
112
113
114
115
116
117
        view.when().then(() => {
          // When the view is ready, clone the heatmap renderer
          // from the only layer in the web map

          const layer = view.map.layers.getItemAt(0);
          const heatmapRenderer = layer.renderer.clone();

          // The following simple renderer will render all points as simple
          // markers at certain scales
          const simpleRenderer = {
            type: "simple",
            symbol: {
              type: "simple-marker",
              color: "#c80000",
              size: 5
            }
          };

          // When the scale is larger than 1:72,224 (zoomed in passed that scale),
          // then switch from a heatmap renderer to a simple renderer. When zoomed
          // out beyond that scale, switch back to the heatmap renderer
          reactiveUtils.watch(
            () => view.scale,
            (scale) => {
              layer.renderer = scale <= 72224 ? simpleRenderer : heatmapRenderer;
            }
          );
        });

This will create a more ideal visualization at large and small scales.

Image preview of related sample Intro to heatmap

Intro to heatmap

Visualize points with a heatmap

Image preview of related sample Create a static heatmap

Create a static heatmap

Create a static heatmap that doesn't adjust based on scale

Image preview of related sample Visualize points in a scene with a heatmap

Visualize points in a scene with a heatmap

Visualize points in a scene with a heatmap

Heatmap

Learn how to represent point features as a continuous heatmap surface.

HeatmapRenderer

Read the API Reference for more information.

Your browser is no longer supported. Please upgrade your browser for the best experience. See our browser deprecation post for more details.