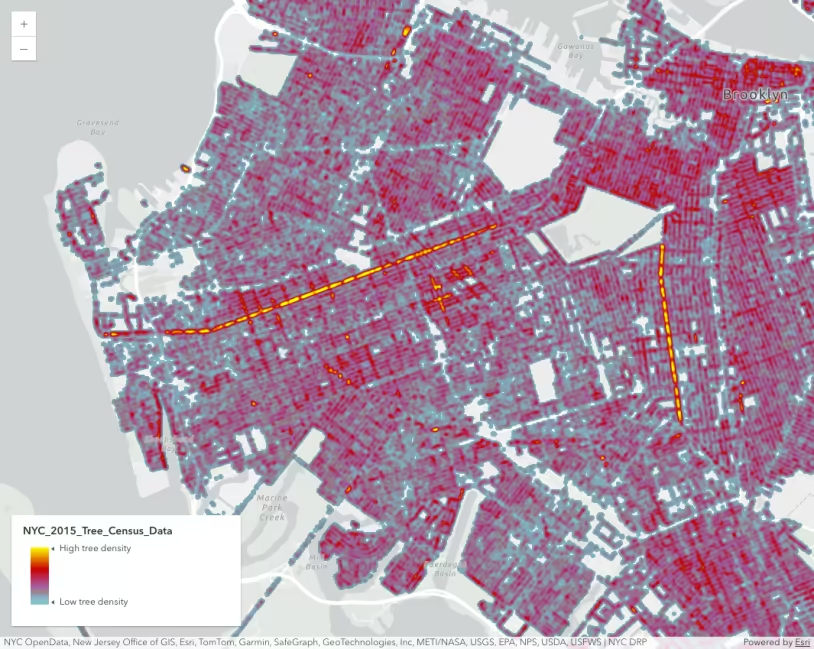
This sample demonstrates how to construct a HeatmapRenderer for visualizing large, dense point datasets. The HeatmapRenderer visualizes points as a raster surface where strong colors indicate areas with a high density of points. Areas with weak or no colors indicate places that don’t have many points.
Knowledge of how the heatmap is implemented is crucial for understanding how to construct the renderer. Each pixel in the view has a density value depending on its proximity to one or more points. If a field is specified, then the density value is multiplied by the field value.
The heatmap is constructed by passing a set of colorStops to the renderer. These map a specific color to a ratio value. The ratio represents the ratio of the pixel’s density value to the maxDensity of the renderer. Therefore, the lower the maxDensity, the hotter the map will look.
const renderer = {  type: "heatmap",  colorStops: [    { color: "rgba(63, 40, 102, 0)", ratio: 0 },    { color: "#472b77", ratio: 0.083 },    { color: "#4e2d87", ratio: 0.166 },    { color: "#563098", ratio: 0.249 },    { color: "#5d32a8", ratio: 0.332 },    { color: "#6735be", ratio: 0.415 },    { color: "#7139d4", ratio: 0.498 },    { color: "#7b3ce9", ratio: 0.581 },    { color: "#853fff", ratio: 0.664 },    { color: "#a46fbf", ratio: 0.747 },    { color: "#c29f80", ratio: 0.83 },    { color: "#e0cf40", ratio: 0.913 },    { color: "#ffff00", ratio: 1 },  ],  maxDensity: 0.01,  minDensity: 0,};
const layer = new CSVLayer({  url: "https://earthquake.usgs.gov/earthquakes/feed/v1.0/summary/2.5_week.csv",  title: "Magnitude 2.5+ earthquakes from the last week",  renderer: renderer,});
Related samples and resources
Create a scale-dependent visualization
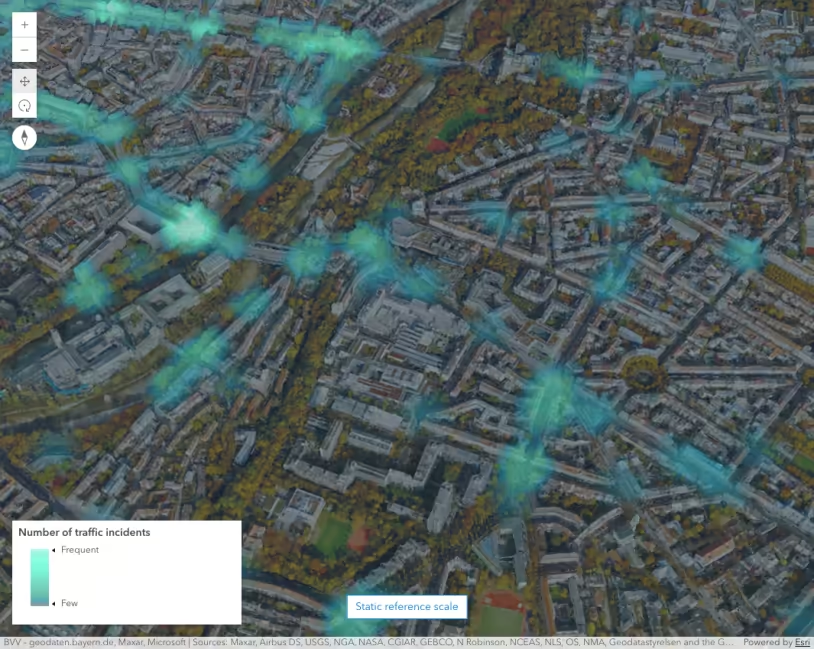
Visualize points in a scene with a heatmap