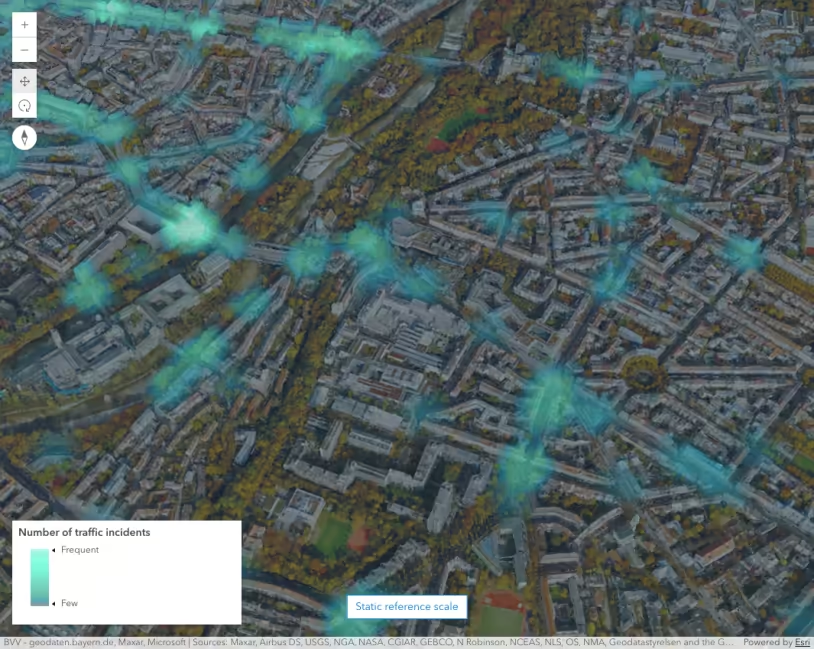
This sample demonstrates how to create a static HeatmapRenderer so it doesn’t dynamically update as the user zooms in and out. It visualizes the density of trees in the 2015 New York City tree census.
By default, the heatmap updates dynamically on zoom. This means the heatmap will appear hotter as you zoom out because points appear to coalesce in screen space. As you zoom in, heatmaps appear colder since points in screen space will appear to have more space between them. When configuring a HeatmapRenderer, you can lock your settings to the view scale so the heatmap will always appear consistent as you zoom in an out.
See the images below to compare the differences between a dynamic and static heatmap.
| Zoom offset from reference scale | Static (reference scale) | Dynamic (no reference scale) |
|---|---|---|
| +1 LOD | 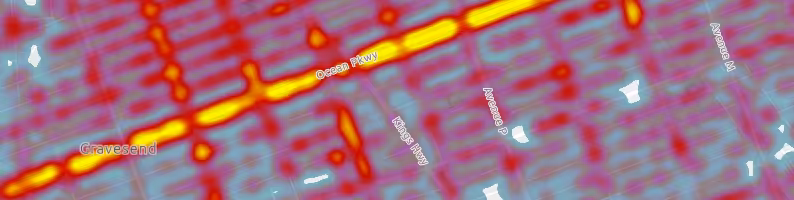 | 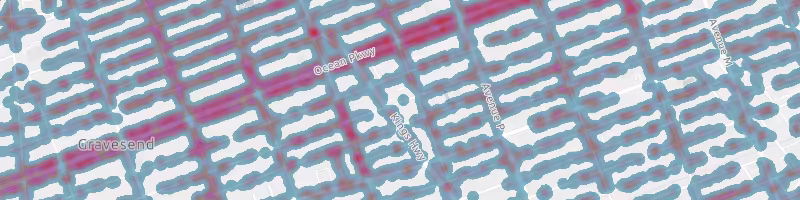 |
| reference scale | 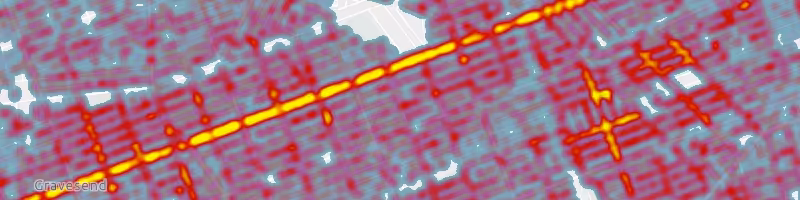 | |
| -1 LOD | 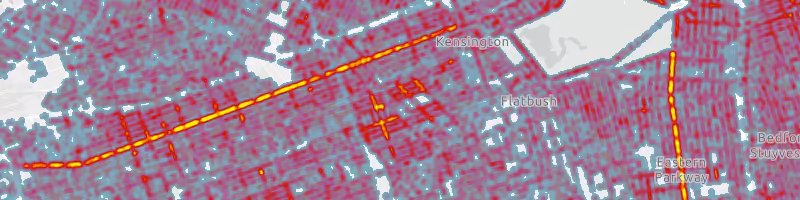 | 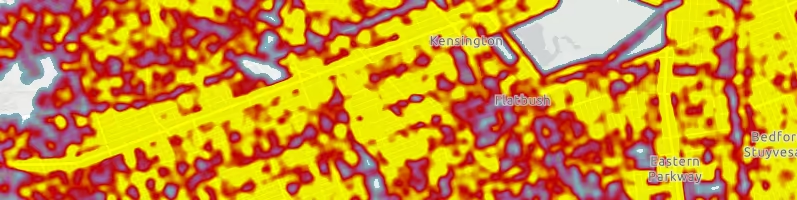 |
To create a static heatmap, simply set the referenceScale property of the renderer to the view scale where you want to preserve the appearance of the heatmap across all scales.
const renderer = { type: "heatmap", colorStops: [ { color: [133, 193, 200, 0], ratio: 0 }, { color: [133, 193, 200, 0], ratio: 0.01 }, { color: [133, 193, 200, 255], ratio: 0.01 }, { color: [133, 193, 200, 255], ratio: 0.01 }, { color: [144, 161, 190, 255], ratio: 0.0925 }, { color: [156, 129, 132, 255], ratio: 0.175 }, { color: [167, 97, 170, 255], ratio: 0.2575 }, { color: [175, 73, 128, 255], ratio: 0.34 }, { color: [184, 48, 85, 255], ratio: 0.4225 }, { color: [192, 24, 42, 255], ratio: 0.505 }, { color: [200, 0, 0, 255], ratio: 0.5875 }, { color: [211, 51, 0, 255], ratio: 0.67 }, { color: [222, 102, 0, 255], ratio: 0.7525 }, { color: [233, 153, 0, 255], ratio: 0.835 }, { color: [244, 204, 0, 255], ratio: 0.9175 }, { color: [255, 255, 0, 255], ratio: 1 }, ], maxDensity: 0.319, minDensity: 0, // settings for heatmap apply only to this scale // so renderer will look consistent without // dynamically updating on zoom referenceScale: 36111, radius: 6, legendOptions: { minLabel: "Low tree density", maxLabel: "High tree density", }, };Related samples and resources
Intro to heatmap
Create a scale-dependent visualization