View associations

What are associations?

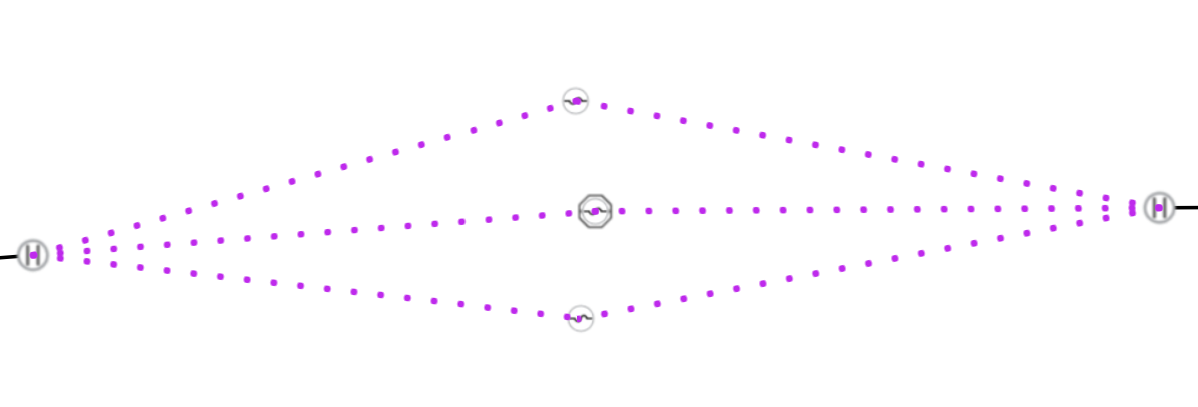
The utility network associations model connectivity, containment, and structural attachment relations between assets. Associations do not have a spatial presence, so the provides a function which, given a specific extent, synthesizes and returns the association geometries in it. This guide page will showcase how to return and visualize associations in a WebMap containing a utility network.

Or a utility network and associations to model a storm water network.

Define the query parameters

Use the SynthesizeAssociationGeometriesParameters class to define the parameters for querying associations. First, make sure to load the utility network from a WebMap, as demonstrated in Introduction to utility networks. In the following code snippet, the parameters are set to return the structural attachment and connectivity associations. The example returns a maximum of 500 associations within the current view extent.

1
2
3
4
5
6
7
8
9
10
11
12
13
14
15
16
17
18
19
20
21
view.when(async () => {
  // Check if webMap contains utility networks.
  if (webMap.utilityNetworks.length > 0 ) {

    // Assigns the utility network at index 0 to utilityNetwork.
    utilityNetwork = webMap.utilityNetworks.getItemAt(0);

    // Triggers the loading of the UtilityNetwork instance.
    await utilityNetwork.load();

    // Define parameters needed to query associations
    const associationParameters = new SynthesizeAssociationGeometriesParameters({
      extent: view.extent,
      returnAttachmentAssociations: true,
      returnConnectivityAssociations: true,
      returnContainerAssociations: false,
      outSR: utilityNetwork.spatialReference,
      maxGeometryCount: 500
    });
  }
});

Obtain the associations

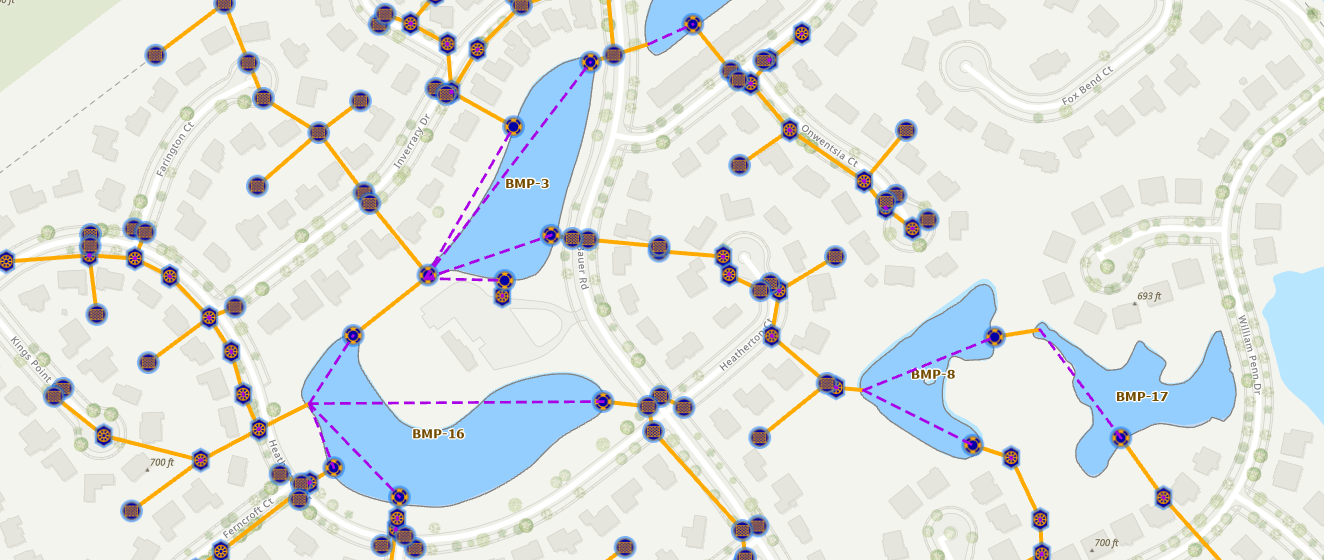
Next, the defined query parameters must be passed into the synthesizeAssociationGeometries() method. This method will return the associations within a specified extent.

1
2
3
// Obtain the associations returned
const viewAssociationsResult = await synthesizeAssociationGeometries.
  synthesizeAssociationGeometries(utilityNetwork.networkServiceUrl, associationParameters);

Add the results as graphics

Then, render the associations returned from synthesizeAssociationGeometries() as graphics. Each association is converted to a graphic using the returned geometries. In the following example, the associationType determines the color of the line symbology for the association graphics.

association-graphic
Expand
1
2
3
4
5
6
7
8
9
10
11
12
13
14
15
16
17
18
19
20
21
22
23
24
25
26
27
28
29
30
31
32
33
34
35
36
37
38
39
40
41
42
43
44
45
46
47
48
49
50
51
52
53
54
55
56
57
58
59
60
61
62
63
64
65
66
67
68
69
70
71
72
73
74
75
76
77
78
79
80
81
82
83
84
85
86
87
88
89
90
91
92
93
94
95
96
97
98
99
100
101
102
103
104
105
106
            // Define parameters needed to query associations
            const associationParameters = new SynthesizeAssociationGeometriesParameters({
              extent: view.extent,
              returnAttachmentAssociations: true,
              returnConnectivityAssociations: true,
              returnContainerAssociations: false,
              outSR: utilityNetwork.spatialReference,
              maxGeometryCount: 500
            });

            // Synthesize associations
            const associationResults = await synthesizeAssociationGeometries.synthesizeAssociationGeometries(utilityNetwork.networkServiceUrl, associationParameters);

            // Loop through returned associations and create graphics with the geometries
            // Association type decides what color the line symbol
            const associationGraphics = associationResults.associations.map((association) => {
              return new Graphic({
                geometry: {
                  type: "polyline",
                  paths: association.geometry.paths,
                  spatialReference: association.geometry.spatialReference,
                },
                symbol: {
                  type: "simple-line", // autocasts as SimpleLineSymbol()
                  style: "dot",
                  color: (association.associationType === "connectivity") ? [190, 41, 236] : [57, 255, 20], // Connectivity: Purple; Attachment: Green
                  width: 4
                }
              });
            });

            // Add the graphics to the view
            view.graphics.addMany(associationGraphics);
Expand

Your browser is no longer supported. Please upgrade your browser for the best experience. See our browser deprecation post for more details.

The developer dashboard has moved

You can no longer sign into this site. Go to your ArcGIS portal or the ArcGIS Location Platform dashboard to perform management tasks.

Your ArcGIS portal

Create, manage, and access API keys and OAuth 2.0 developer credentials, hosted layers, and data services.

Your ArcGIS Location Platform dashboard

Manage billing, monitor service usage, and access additional resources.

Learn more about these changes in the What's new in Esri Developers June 2024 blog post.

Close