View associations

What are associations?

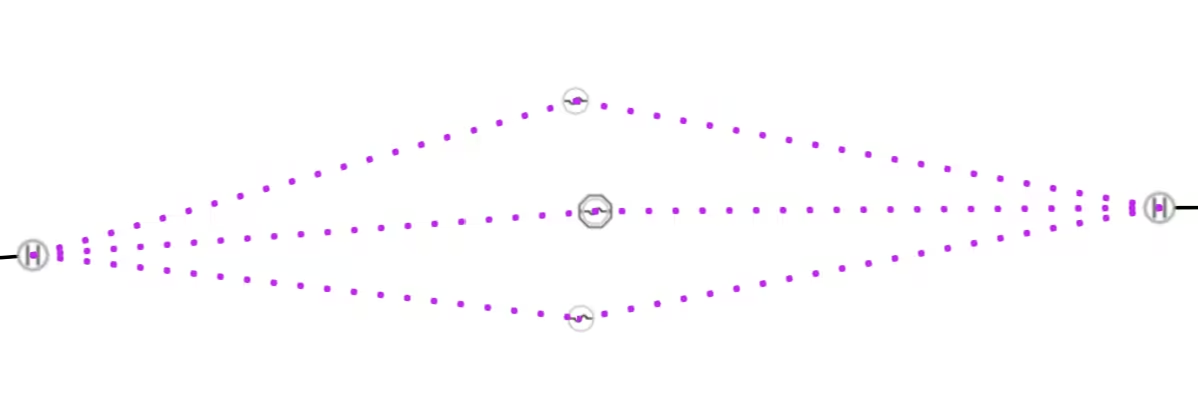
The utility network associations model connectivity, containment, and structural attachment relations between assets. Associations do not have a spatial presence, so the ArcGIS Maps SDK for JavaScript provides a function which, given a specific extent, synthesizes and returns the association geometries in it. This guide page will showcase how to return and visualize associations in a WebMap containing a utility network.

Or a utility network and associations to model a storm water network.

Define the query parameters

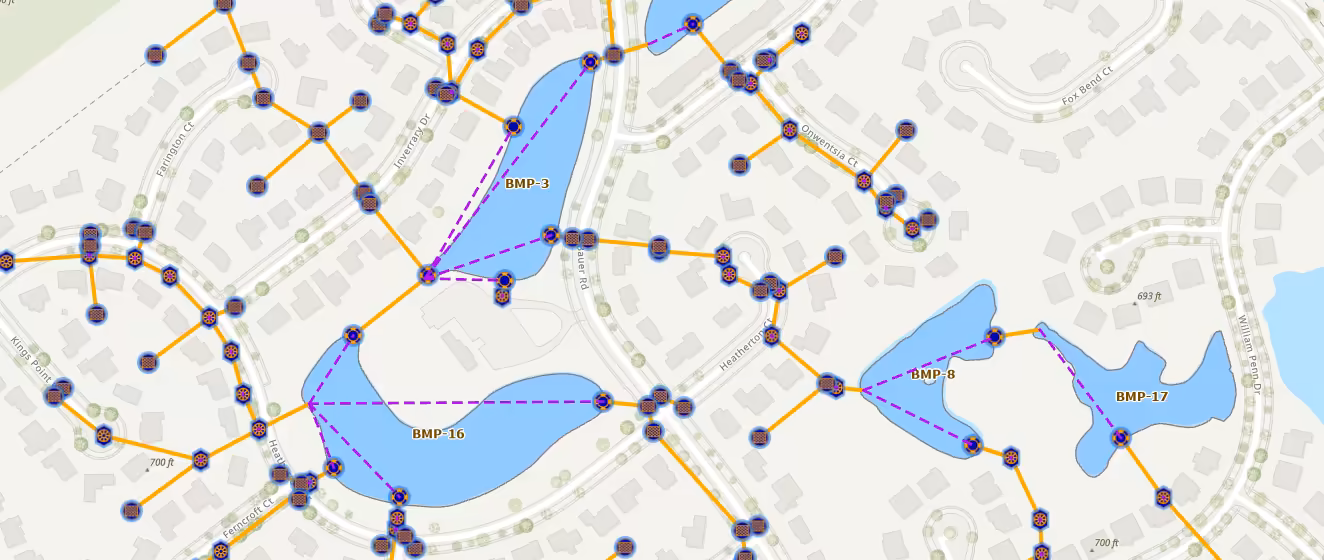
Use the SynthesizeAssociationGeometriesParameters class to define the parameters for querying associations. First, make sure to load the utility network from a WebMap, as demonstrated in Introduction to utility networks. In the following code snippet, the parameters are set to return the structural attachment and connectivity associations. The example returns a maximum of 500 associations within the current view extent.

Use dark colors for code blocksCopy
1
2
3
4
5
6
7
8
9
10
11
12
13
14
15
16
17
18
19
20
21
view.when(async () => {
  // Check if webMap contains utility networks.
  if (webMap.utilityNetworks.length > 0 ) {

    // Assigns the utility network at index 0 to utilityNetwork.
    utilityNetwork = webMap.utilityNetworks.getItemAt(0);

    // Triggers the loading of the UtilityNetwork instance.
    await utilityNetwork.load();

    // Define parameters needed to query associations
    const associationParameters = new SynthesizeAssociationGeometriesParameters({
      extent: view.extent,
      returnAttachmentAssociations: true,
      returnConnectivityAssociations: true,
      returnContainerAssociations: false,
      outSR: utilityNetwork.spatialReference,
      maxGeometryCount: 500
    });
  }
});

Obtain the associations

Next, the defined query parameters must be passed into the synthesizeAssociationGeometries() method. This method will return the associations within a specified extent.

Use dark colors for code blocksCopy
1
2
3
// Obtain the associations returned
const viewAssociationsResult = await synthesizeAssociationGeometries.
  synthesizeAssociationGeometries(utilityNetwork.networkServiceUrl, associationParameters);

Add the results as graphics

Then, render the associations returned from synthesizeAssociationGeometries() as graphics. Each association is converted to a graphic using the returned geometries. In the following example, the associationType determines the color of the line symbology for the association graphics.

association-graphic
Expand
Use dark colors for code blocksCopy
1
2
3
4
5
6
7
8
9
10
11
12
13
14
15
16
17
18
19
20
21
22
23
24
25
26
27
28
29
30
31
32
33
34
35
36
37
38
39
40
41
42
43
44
45
46
47
48
49
50
51
52
53
54
55
56
57
58
59
60
61
62
63
64
65
66
67
68
69
70
71
72
73
74
75
76
77
78
79
80
81
82
83
84
85
86
87
88
89
90
91
92
93
94
95
96
97
98
99
100
101
102
103
104
105
106
            // Define parameters needed to query associations
            const associationParameters = new SynthesizeAssociationGeometriesParameters({
              extent: view.extent,
              returnAttachmentAssociations: true,
              returnConnectivityAssociations: true,
              returnContainerAssociations: false,
              outSR: utilityNetwork.spatialReference,
              maxGeometryCount: 500
            });

            // Synthesize associations
            const associationResults = await synthesizeAssociationGeometries.synthesizeAssociationGeometries(utilityNetwork.networkServiceUrl, associationParameters);

            // Loop through returned associations and create graphics with the geometries
            // Association type decides what color the line symbol
            const associationGraphics = associationResults.associations.map((association) => {
              return new Graphic({
                geometry: {
                  type: "polyline",
                  paths: association.geometry.paths,
                  spatialReference: association.geometry.spatialReference,
                },
                symbol: {
                  type: "simple-line", // autocasts as SimpleLineSymbol()
                  style: "dot",
                  color: (association.associationType === "connectivity") ? [190, 41, 236] : [57, 255, 20], // Connectivity: Purple; Attachment: Green
                  width: 4
                }
              });
            });

            // Add the graphics to the view
            view.graphics.addMany(associationGraphics);
Expand

Your browser is no longer supported. Please upgrade your browser for the best experience. See our browser deprecation post for more details.