What is a custom basemap style?
The ArcGIS Basemap Styles service
The service also supports accessing custom basemap styles. A custom basemap style is derived from an ArcGIS Basemap style or an Open Basemaps style and is created with the ArcGIS Vector Tile Style Editor
You use a custom basemap style to:
- Create your own unique basemap color scheme for a mapping application.
- Emphasize or deemphasize geographic features and labels in the default basemap styles.
- Match geographic features and labels to a specific set of branding colors or fonts.
- Create new styles that can be shared with others.
How to use a custom basemap style
The typical workflow to create and use a custom basemap style is:
1. Create a new style
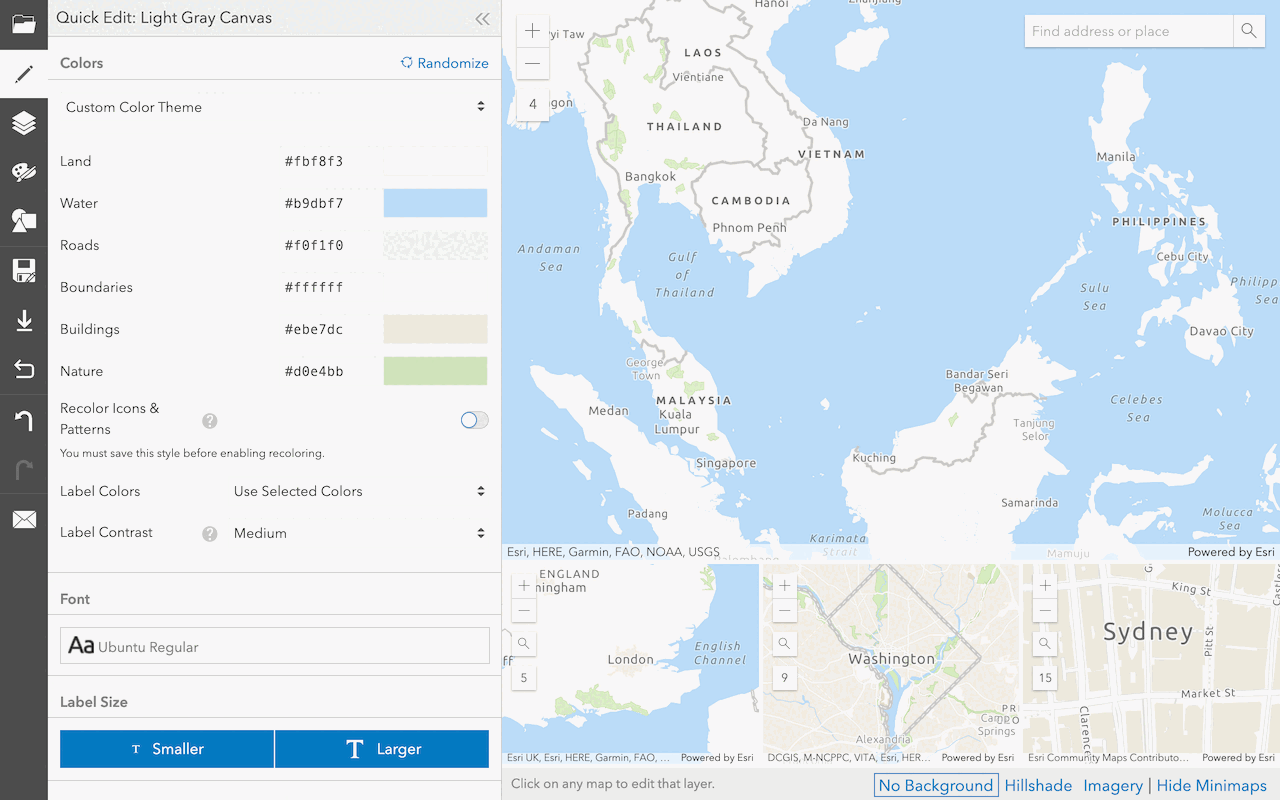
To create a new custom basemap style, you use the ArcGIS Vector Tile Style Editor. You start by selecting an ArcGIS Basemap style or Open Basemaps style style such as: arcgis/streets, arcgis/topographic, open/osm-style, or open/light-gray. The editor copies the existing style and then allows you to start editing the new style. The editor provides a number of tools that let you inspect and set the visual properties for all of the features and labels in each layer. The most common layer properties you edit in the style are the following:
- Visibility
- Visible zoom range
- Fill color
- Outline color
- Opacity
- Size and font type for labels
- Swatches
- Glyphs
The general steps to create a style are:
- Sign in to your portal
ArcGIS portal, also known as a portal, is a website with applications and tools that can be used to create, manage, access, and share geospatial content and data. It supports security and authentication, developer credentials, content and data service management, user and group management, and site administration. A portal can be hosted in Esri's infrastructure or your own infrastructure. and go to ArcGIS Vector Tile Style Editor. - Select a default basemap style.
- Start editing the visual properties for each layer in the style.

2. Manage the style
When you are finished editing the new basemap style, you need to save the style with the ArcGIS Vector Tile Style Editor. The new style is saved in ArcGIS as a vector tile layer (item)
After the style is saved, there are two tools you can use to manage it:
- ArcGIS Vector Tile Style Editor: Use the editor to share and edit style; or,
- Item page: Use the item to set the properties and sharing level. You can also use this page to view the JSON for the style.
Below is an example of an item for a custom basemap style:
- Item page URL: https://www.arcgis.com/home/item.html?id=692f461ceb2f4d598aaf8d2837b859da
- Item ID:
692f461ceb2f4d598aaf8d2837b859da.

3. Access the style
To display a custom basemap style in a map or scene, you need to reference the item by its item ID
To access the JSON for a basemap style:
- Go to your portal.
- Find the style item ID (tile layer).
- Set the item ID as a portal item (ArcGIS Maps SDKs only) or as a path parameter in the
/styles/items/{itemendpoint._id} - Set the access token as an environment variable (ArcGIS Maps SDKs only), authorization header, or query parameter.
- Display the style as a vector tile layer in a basemap.
Below is an example of an item ID and service URL for a style:
- Item ID:
692f461ceb2f4d598aaf8d2837b859da - Service URL:
https://basemapstyles-api.arcgis.com/arcgis/rest/services/styles/v2/styles/items/{item _id}?token= <ACCESS _TOKEN >
esriConfig.apiKey = "YOUR_ACCESS_TOKEN";
const basemap = new Basemap({
baseLayers: [
new VectorTileLayer({
portalItem: {
id: "692f461ceb2f4d598aaf8d2837b859da", // Custom basemap style
},
}),
],
});
const map = new Map({
basemap: basemap,
});
Style format
The item for a custom basemap style contains the visual properties stored as JSON that follows the Mapbox Style Specification. The style JSON contains drawing resources and properties such as the glyphs, version, sprite, sources, and layers.
Each layer in the style contains the visual properties for the features in the vector tile layer such as land areas, oceans, lakes, parks, streets, and place labels. Some of the key properties are id, type, and paint. The paint property contains the values used by a client application to display the layer, including the color and color ranges.
Below is an example of the JSON:
{
"glyphs": "https://basemaps-api.arcgis.com/arcgis/rest/services/World_Basemap_v2/VectorTileServer/resources/fonts/{fontstack}/{range}.pbf",
"version": 8,
"sprite": "https://www.arcgis.com/sharing/rest/content/items/d2ff12395aeb45998c1b154e25d680e5/resources/styles/sprite-1551462317894",
"sources": {
"esri": {
"url": "https://basemaps-api.arcgis.com/arcgis/rest/services/World_Basemap_v2/VectorTileServer",
"type": "vector"
}
},
"layers": [
{
"paint": {
"background-opacity": 0,
"background-color": "#c9def0",
"text-color": "#828282",
"text-halo-color": "#fbfbfb"
},
"type": "background",
"id": "background",
"layout": {
"visibility": "none"
},
"showProperties": false
},
{
"layout": {},
"paint": {
"fill-color": "#fbf8f3",
"text-color": "#828282",
"text-halo-color": "#fbfbfb"
},
"source": "esri",
"source-layer": "Land",
"type": "fill",
"id": "Land"
},
{
"layout": {
"visibility": "none"
},
"paint": {
"fill-color": "#f4ede2",
"text-color": "#828282",
"text-halo-color": "#fbfbfb"
},
"source": "esri",
"minzoom": 5,
"source-layer": "Urban area",
"maxzoom": 15,
"type": "fill",
"id": "Urban area",
"showProperties": false
},
{
"layout": {},
"paint": {
"fill-outline-color": "#abc98e",
"fill-color": "#b7d29d",
"text-color": "#828282",
"text-halo-color": "#fbfbfb"
},
"source": "esri",
"minzoom": 12,
"source-layer": "Openspace or forest",
"type": "fill",
"id": "Openspace or forest",
"showProperties": false
},
{
"layout": {},
"paint": {
"fill-opacity": 0.6,
"fill-color": {
"base": 1,
"stops": [
[
3,
"#ddf0ca"
],
[
6,
"#cbe5b1"
],
[
10,
"#bae291"
]
]
},
"fill-outline-color": "#bbd4a2"
},
"source": "esri",
"minzoom": 3,
"source-layer": "Admin0 forest or park",
"type": "fill",
"id": "Admin0 forest or park",
"showProperties": false
},
.../ 20240111173702
// https://www.arcgis.com/sharing/rest/content/items/692f461ceb2f4d598aaf8d2837b859da/resources/styles/root.json
{
"version": 8,
"sprite": "https://www.arcgis.com/sharing/rest/content/items/692f461ceb2f4d598aaf8d2837b859da/resources/sprites/sprite-1701462883165",
"glyphs": "https://basemaps.arcgis.com/arcgis/rest/services/World_Basemap_v2/VectorTileServer/resources/fonts/{fontstack}/{range}.pbf",
"sources": {
"esri": {
"type": "vector",
"url": "https://basemaps.arcgis.com/arcgis/rest/services/World_Basemap_v2/VectorTileServer",
"tiles": [
"https://basemaps.arcgis.com/arcgis/rest/services/World_Basemap_v2/VectorTileServer/tile/{z}/{y}/{x}.pbf"
]
}
},
"layers": [
{
"id": "background",
"type": "background",
"paint": {
"background-color": "#5215ff"
},
"layout": {
}
},
{
"id": "Land",
"type": "fill",
"source": "esri",
"source-layer": "Land",
"filter": [
"in",
"_symbol",
0,
1
],
"layout": {
},
"paint": {
"fill-color": "#efb1ff",
"fill-opacity": 1
}
},
{
"id": "Urban area",
"type": "fill",
"source": "esri",
"source-layer": "Urban area",
"minzoom": 5,
"maxzoom": 15,
"layout": {
},
"paint": {
"fill-color": "#e7a5f9"
}
},
{
"id": "Openspace or forest",
"type": "fill",
"source": "esri",
"source-layer": "Openspace or forest",
"minzoom": 12,
"layout": {
},
"paint": {
"fill-color": "#7308f3",
"fill-outline-color": "#6600ee"
}
},
{
"id": "Admin0 forest or park",
"type": "fill",
"source": "esri",
"source-layer": "Admin0 forest or park",
"minzoom": 7,
"layout": {
},
"paint": {
"fill-color": "#7f22f9",
"fill-outline-color": "#7308f3"
}
},
{
"id": "Admin1 forest or park",
"type": "fill",
"source": "esri",
"source-layer": "Admin1 forest or park",
"minzoom": 8,
"layout": {
},
"paint": {
"fill-color": "#7f22f9",
"fill-outline-color": "#7308f3"
}
},
{
"id": "Zoo",
"type": "fill",
"source": "esri",
"source-layer": "Zoo",
"minzoom": 12,
"layout": {
},
"paint": {
"fill-color": "#7308f3"
}
},
{
"id": "Airport/Airport property",
"type": "fill",
"source": "esri",
"source-layer": "Airport",
"filter": [
"==",
"_symbol",
1
],
"minzoom": 9,
"layout": {
},
"paint": {
"fill-color": "#d590e8"
}
},
{
"id": "Airport/Airport runway",
"type": "fill",
"source": "esri",
"source-layer": "Airport",
"filter": [
"==",
"_symbol",
0
],
"minzoom": 11,
"layout": {
},
"paint": {
"fill-color": "#d590e8"
}
},
{
"id": "Pedestrian",
"type": "fill",
"source": "esri",
"source-layer": "Pedestrian",
"minzoom": 14,
"layout": {
},
"paint": {
"fill-color": "#ec8cff"
}
},
{
"id": "Park or farming",
"type": "fill",
"source": "esri",
"source-layer": "Park or farming",
"minzoom": 12,
"layout": {
},
"paint": {
"fill-color": "#7308f3"
}
},
{
"id": "Beach",
"type": "fill",
"source": "esri",
"source-layer": "Beach",
"minzoom": 13,
"layout": {
},
"paint": {
"fill-pattern": "Special area of interest/Sand"
}
},
...Code examples
Create and display a custom basemap style
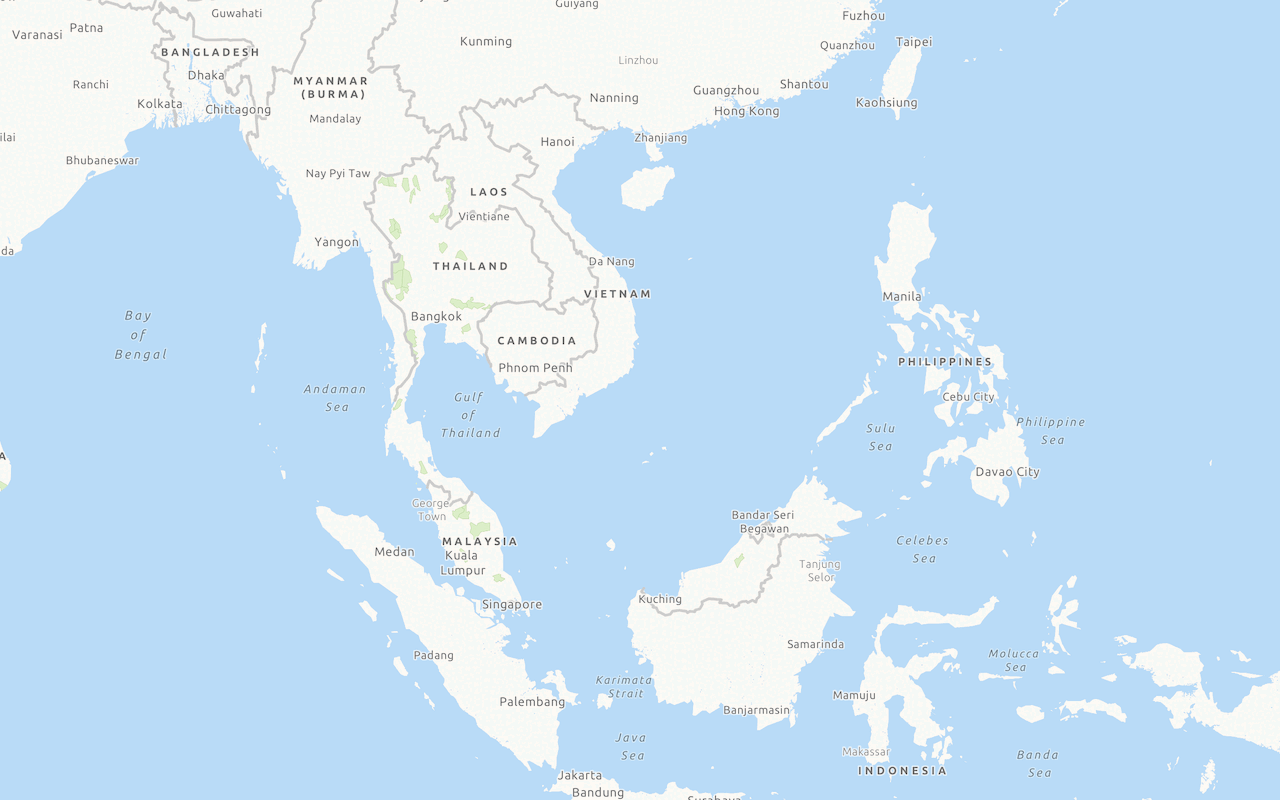
This example shows you how to create a custom basemap style with ArcGIS Vector Tile Style Editor and display it in an application. You use the editor to copy the default light gray canvas style and then customize it. When the custom basemap style is loaded by the application, it should look the same as the style created with ArcGIS Vector Tile Style Editor. Since the item sharing level is set to everyone (public), the application does not need to use an access token to access the style.
Create
- Sign in to your portal and go to ArcGIS Vector Tile Style Editor.
- Click New style > Light gray canvas.
- In the editor, click Randomize to set the colors or use the other tools to set the colors, labels, zoom levels, and other properties for each layer.
Manage
- In ArcGIS Vector Tile Style Editor, click Save as.
- Set the title, tags, and folder.
- Set Share with > Everyone (public) to make it easy to access.
Access
- Find the item ID (created above) or use
692f461ceb2f4d598aaf8d2837b859da. - Write code to create a map and access the item.
- Set the access token as an environment variable (ArcGIS Maps SDKs only), authorization header, or query parameter.
- Display the style as vector tile layer in a basemap.
esriConfig.apiKey = "YOUR_ACCESS_TOKEN";
const basemap = new Basemap({
baseLayers: [
new VectorTileLayer({
portalItem: {
id: "692f461ceb2f4d598aaf8d2837b859da", // Custom basemap style
},
}),
],
});
const map = new Map({
basemap: basemap,
});
Tutorials
Create a custom basemap style
Use the ArcGIS Vector Tile Style Editor to style a vector tile basemap layer.
Display a custom basemap style
Add and display a styled vector tile basemap layer.