Display common symbols for all graphics in a graphics overlay with a renderer.
Use case
Graphics are often used to display data that changes location regularly because they are held in memory instead of being persisted to the map. When a number of graphics are required to share the same style, a simple renderer can be applied to the graphics overlay containing the graphics. For example, the location of mobile taxis from a same company could be plotted on a map with each taxi marked by a relevant symbol.
How to use the sample
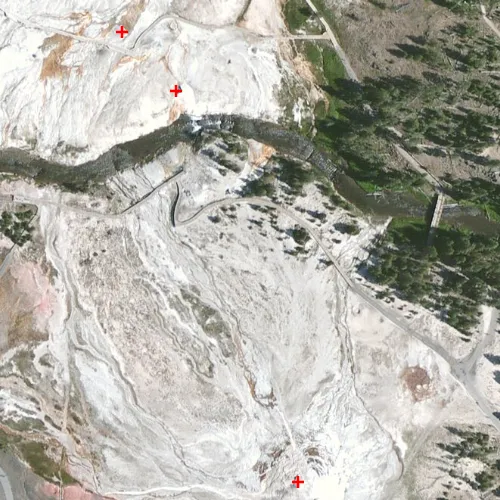
The sample loads with a predefined simple renderer, which displays a red cross simple marker symbol for the graphics in the graphics overlay.
How it works
- Create a
GraphicsOverlay. - Create a number of
Pointobjects with x, y and spatial reference parameters. - Create a
SimpleMarkerSymbolpassing in aSimpleMarkerSymbolStyle, color and size as parameters. - Create a simple renderer with
SimpleRenderer(simpleMarkerSymbol). - Set the simple renderer to the graphics overlay using
graphicsOverlay::setRenderer(simpleRenderer). - Create a number of
Graphicobjects with the points initiated in step 2. - Add the graphics to the graphics overlay with
graphicsOverlay::graphics()::append(graphic).
Relevant API
- Graphic
- GraphicsOverlay
- Point
- SimpleMarkerSymbol
- SimpleRenderer
Additional information
Renderers are used to display graphics that don’t already have a symbol set. A renderer will not override a graphic’s symbol if one has been set.
Tags
graphics, marker, renderer, symbol, symbolize, symbology
Sample code
// [WriteFile Name=Simple_Renderer, Category=DisplayInformation]// [Legal]// Copyright 2016 Esri.//// Licensed under the Apache License, Version 2.0 (the "License");// you may not use this file except in compliance with the License.// You may obtain a copy of the License at// http://www.apache.org/licenses/LICENSE-2.0//// Unless required by applicable law or agreed to in writing, software// distributed under the License is distributed on an "AS IS" BASIS,// WITHOUT WARRANTIES OR CONDITIONS OF ANY KIND, either express or implied.// See the License for the specific language governing permissions and// limitations under the License.// [Legal]
#ifdef PCH_BUILD#include "pch.hpp"#endif // PCH_BUILD
// sample headers#include "Simple_Renderer.h"
// ArcGIS Maps SDK headers#include "Envelope.h"#include "Graphic.h"#include "GraphicListModel.h"#include "GraphicsOverlay.h"#include "GraphicsOverlayListModel.h"#include "Map.h"#include "MapQuickView.h"#include "MapTypes.h"#include "MapViewTypes.h"#include "Point.h"#include "SimpleMarkerSymbol.h"#include "SimpleRenderer.h"#include "SpatialReference.h"#include "SymbolTypes.h"
// Qt headers#include <QFuture>
using namespace Esri::ArcGISRuntime;
Simple_Renderer::Simple_Renderer(QQuickItem* parent) :  QQuickItem(parent){}
Simple_Renderer::~Simple_Renderer() = default;
void Simple_Renderer::init(){  qmlRegisterType<MapQuickView>("Esri.Samples", 1, 0, "MapView");  qmlRegisterType<Simple_Renderer>("Esri.Samples", 1, 0, "Simple_RendererSample");}
void Simple_Renderer::componentComplete(){  QQuickItem::componentComplete();
  // find QML MapView component  m_mapView = findChild<MapQuickView*>("mapView");  m_mapView->setWrapAroundMode(WrapAroundMode::Disabled);
  // Create a map using the imagery basemap  m_map = new Map(BasemapStyle::ArcGISImageryStandard, this);
  // create graphics overlay  m_graphicsOverlay = new GraphicsOverlay(this);
  // create red cross SimpleMarkerSymbol  SimpleMarkerSymbol* crossSymbol = new SimpleMarkerSymbol(SimpleMarkerSymbolStyle::Cross, QColor("red"), 12, this);
  // create renderer and set symbol to crossSymbol  SimpleRenderer* simpleRenderer = new SimpleRenderer(crossSymbol, this);  // set the SimpleRenderer to the GraphicsOverlay  m_graphicsOverlay->setRenderer(simpleRenderer);
  // create points to render  Point oldFaithfulPoint(-110.828140, 44.460458, SpatialReference::wgs84());  Point cascadeGeyserPoint(-110.829004, 44.462438, SpatialReference::wgs84());  Point plumeGeyserPoint(-110.829381, 44.462735, SpatialReference::wgs84());
  // create graphics using points and add them to GraphicsOverlay  addPoint(oldFaithfulPoint);  addPoint(cascadeGeyserPoint);  addPoint(plumeGeyserPoint);
  // Set map to map view  m_mapView->setMap(m_map);
  // set viewpoint using the two farthest points as an envelope with padding  m_mapView->setViewpointGeometryAsync(Envelope(oldFaithfulPoint, plumeGeyserPoint), 50);
  // add GraphicsOverlay to MapView  m_mapView->graphicsOverlays()->append(m_graphicsOverlay);}
void Simple_Renderer::addPoint(Point& point){  // create graphic  Graphic* graphic = new Graphic(point, this);
  // add graphic to Graphic Overlay  m_graphicsOverlay->graphics()->append(graphic);}
// [WriteFile Name=Simple_Renderer, Category=DisplayInformation]// [Legal]// Copyright 2016 Esri.//// Licensed under the Apache License, Version 2.0 (the "License");// you may not use this file except in compliance with the License.// You may obtain a copy of the License at// http://www.apache.org/licenses/LICENSE-2.0//// Unless required by applicable law or agreed to in writing, software// distributed under the License is distributed on an "AS IS" BASIS,// WITHOUT WARRANTIES OR CONDITIONS OF ANY KIND, either express or implied.// See the License for the specific language governing permissions and// limitations under the License.// [Legal]
#ifndef SIMPLE_RENDERER_H#define SIMPLE_RENDERER_H
// Qt headers#include <QQuickItem>
namespace Esri::ArcGISRuntime{ class Map; class MapQuickView; class GraphicsOverlay; class Point;} // namespace Esri::ArcGISRuntime
class Simple_Renderer : public QQuickItem{ Q_OBJECT
public: explicit Simple_Renderer(QQuickItem* parent = nullptr); ~Simple_Renderer() override;
void componentComplete() override; static void init();
private: void addPoint(Esri::ArcGISRuntime::Point& point);
private: Esri::ArcGISRuntime::Map* m_map = nullptr; Esri::ArcGISRuntime::MapQuickView* m_mapView = nullptr; Esri::ArcGISRuntime::GraphicsOverlay* m_graphicsOverlay = nullptr;};
#endif // SIMPLE_RENDERER_H// [WriteFile Name=Simple_Renderer, Category=DisplayInformation]// [Legal]// Copyright 2016 Esri.//// Licensed under the Apache License, Version 2.0 (the "License");// you may not use this file except in compliance with the License.// You may obtain a copy of the License at// http://www.apache.org/licenses/LICENSE-2.0//// Unless required by applicable law or agreed to in writing, software// distributed under the License is distributed on an "AS IS" BASIS,// WITHOUT WARRANTIES OR CONDITIONS OF ANY KIND, either express or implied.// See the License for the specific language governing permissions and// limitations under the License.// [Legal]
import QtQuickimport QtQuick.Controlsimport Esri.Samples
Simple_RendererSample { clip: true width: 800 height: 600
// add a mapView component MapView { anchors.fill: parent objectName: "mapView"
Component.onCompleted: { // Set the focus on MapView to initially enable keyboard navigation forceActiveFocus(); } }}