Display a raster on a map and apply different rendering rules to that raster.
Use case
Raster images whose individual pixels represent elevation values can be rendered in a number of different ways, including representation of slope, aspect, hillshade, and shaded relief. Applying these different rendering rules to the same raster allows for a powerful visual analysis of the data. For example, a geologist could interrogate the raster image to map subtle geological features on a landscape, which may become apparent only through comparing the raster when rendered using several different rules.
How to use the sample
Open the sample and use the picker to select a rendering rule.
How it works
- Create an
ImageServiceRasterusing a URL to an online image service. - After loading the raster, get its
serviceInfoto get a list ofRenderingRuleInfosupported by the service. - Choose a rendering rule info to apply and use it to create a
RenderingRule. - Create a new
ImageServiceRasterusing the same image service URL. - Apply the rendering rule to the new raster.
- Create a
RasterLayerfrom the raster for display.
Relevant API
- ImageServiceRaster
- RasterLayer
- RenderingRule
About the data
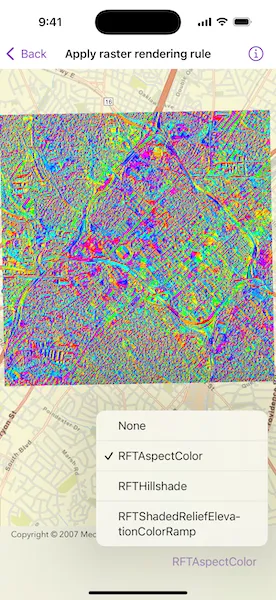
The CharlotteLAS image service contains 9 LAS files covering Charlotte, North Carolina’s downtown area. The LiDAR data was collected in 2007. Four raster rules are available for selection: None, RFTAspectColor, RFTHillshade, and RFTShadedReliefElevationColorRamp.
Additional information
Image service rasters of any type can have rendering rules applied to them; they need not necessarily be elevation rasters. See the list of raster function objects and syntax for rendering rules in the ArcGIS REST API documentation.
Tags
raster, rendering rules, visualization
Sample code
// Copyright 2024 Esri//// Licensed under the Apache License, Version 2.0 (the "License");// you may not use this file except in compliance with the License.// You may obtain a copy of the License at////   https://www.apache.org/licenses/LICENSE-2.0//// Unless required by applicable law or agreed to in writing, software// distributed under the License is distributed on an "AS IS" BASIS,// WITHOUT WARRANTIES OR CONDITIONS OF ANY KIND, either express or implied.// See the License for the specific language governing permissions and// limitations under the License.
import ArcGISimport SwiftUI
struct ApplyRasterRenderingRuleView: View {    /// A map with a streets basemap.    @State private var map = Map(basemapStyle: .arcGISStreets)
    /// An array of raster layers, each with a different rendering rule.    @State private var rasterLayers: [RasterLayer] = []
    /// The name of rendering rule selected by the picker.    @State private var selectedRenderingRule = "None"
    /// The viewpoint for zooming the map view to a layer's extent.    @State private var viewpoint: Viewpoint?
    /// The error shown in the error alert.    @State private var error: (any Error)?
    var body: some View {        MapView(map: map, viewpoint: viewpoint)            .toolbar {                ToolbarItem(placement: .bottomBar) {                    Picker("Rendering Rule", selection: $selectedRenderingRule) {                        ForEach(rasterLayers, id: \.name) { rasterLayer in                            Text(rasterLayer.name)                        }                    }                    .onChange(of: selectedRenderingRule) {                        if let rasterLayer = rasterLayers.first(where: { $0.name == selectedRenderingRule }) {                            setLayer(rasterLayer)                        }                    }                }            }            .task {                // Sets up the raster layers when the sample opens.                do {                    rasterLayers = try await makeRasterLayers()                    await rasterLayers.load()
                    if let rasterLayer = rasterLayers.first {                        setLayer(rasterLayer)                    }                } catch {                    self.error = error                }            }            .errorAlert(presentingError: $error)    }
    /// Sets a given layer on the map and zooms the viewpoint the layer's extent.    /// - Parameter layer: The layer to set.    private func setLayer(_ layer: Layer) {        map.removeAllOperationalLayers()        map.addOperationalLayer(layer)
        if let layerExtent = layer.fullExtent {            viewpoint = Viewpoint(boundingGeometry: layerExtent)        }    }
    /// Creates raster layers for all the rendering rules from an image service raster.    /// - Returns: An array of new `RasterLayer` objects.    private func makeRasterLayers() async throws -> [RasterLayer] {        // Creates and loads an image service raster using an image service URL.        let imageServiceRaster = ImageServiceRaster(url: .charlotteLASImageService)        try await imageServiceRaster.load()
        // Gets the rendering rule infos from the raster's service info.        guard let renderingRuleInfos = imageServiceRaster.serviceInfo?.renderingRuleInfos else {            return []        }
        return renderingRuleInfos.map { renderingRuleInfo in            // Creates another image service raster and sets its rendering rule using the info.            // This is required since the raster can't be loaded when setting its rendering rule.            let imageServiceRaster = ImageServiceRaster(url: .charlotteLASImageService)            imageServiceRaster.renderingRule = RenderingRule(info: renderingRuleInfo)
            // Creates a layer using the raster.            let rasterLayer = RasterLayer(raster: imageServiceRaster)            rasterLayer.name = renderingRuleInfo.name
            return rasterLayer        }    }}
private extension URL {    /// The web URL to the "CharlotteLAS" image service containing LAS files for Charlotte, NC downtown area.    static var charlotteLASImageService: URL {        URL(string: "https://sampleserver6.arcgisonline.com/arcgis/rest/services/CharlotteLAS/ImageServer")!    }}
#Preview {    ApplyRasterRenderingRuleView()}