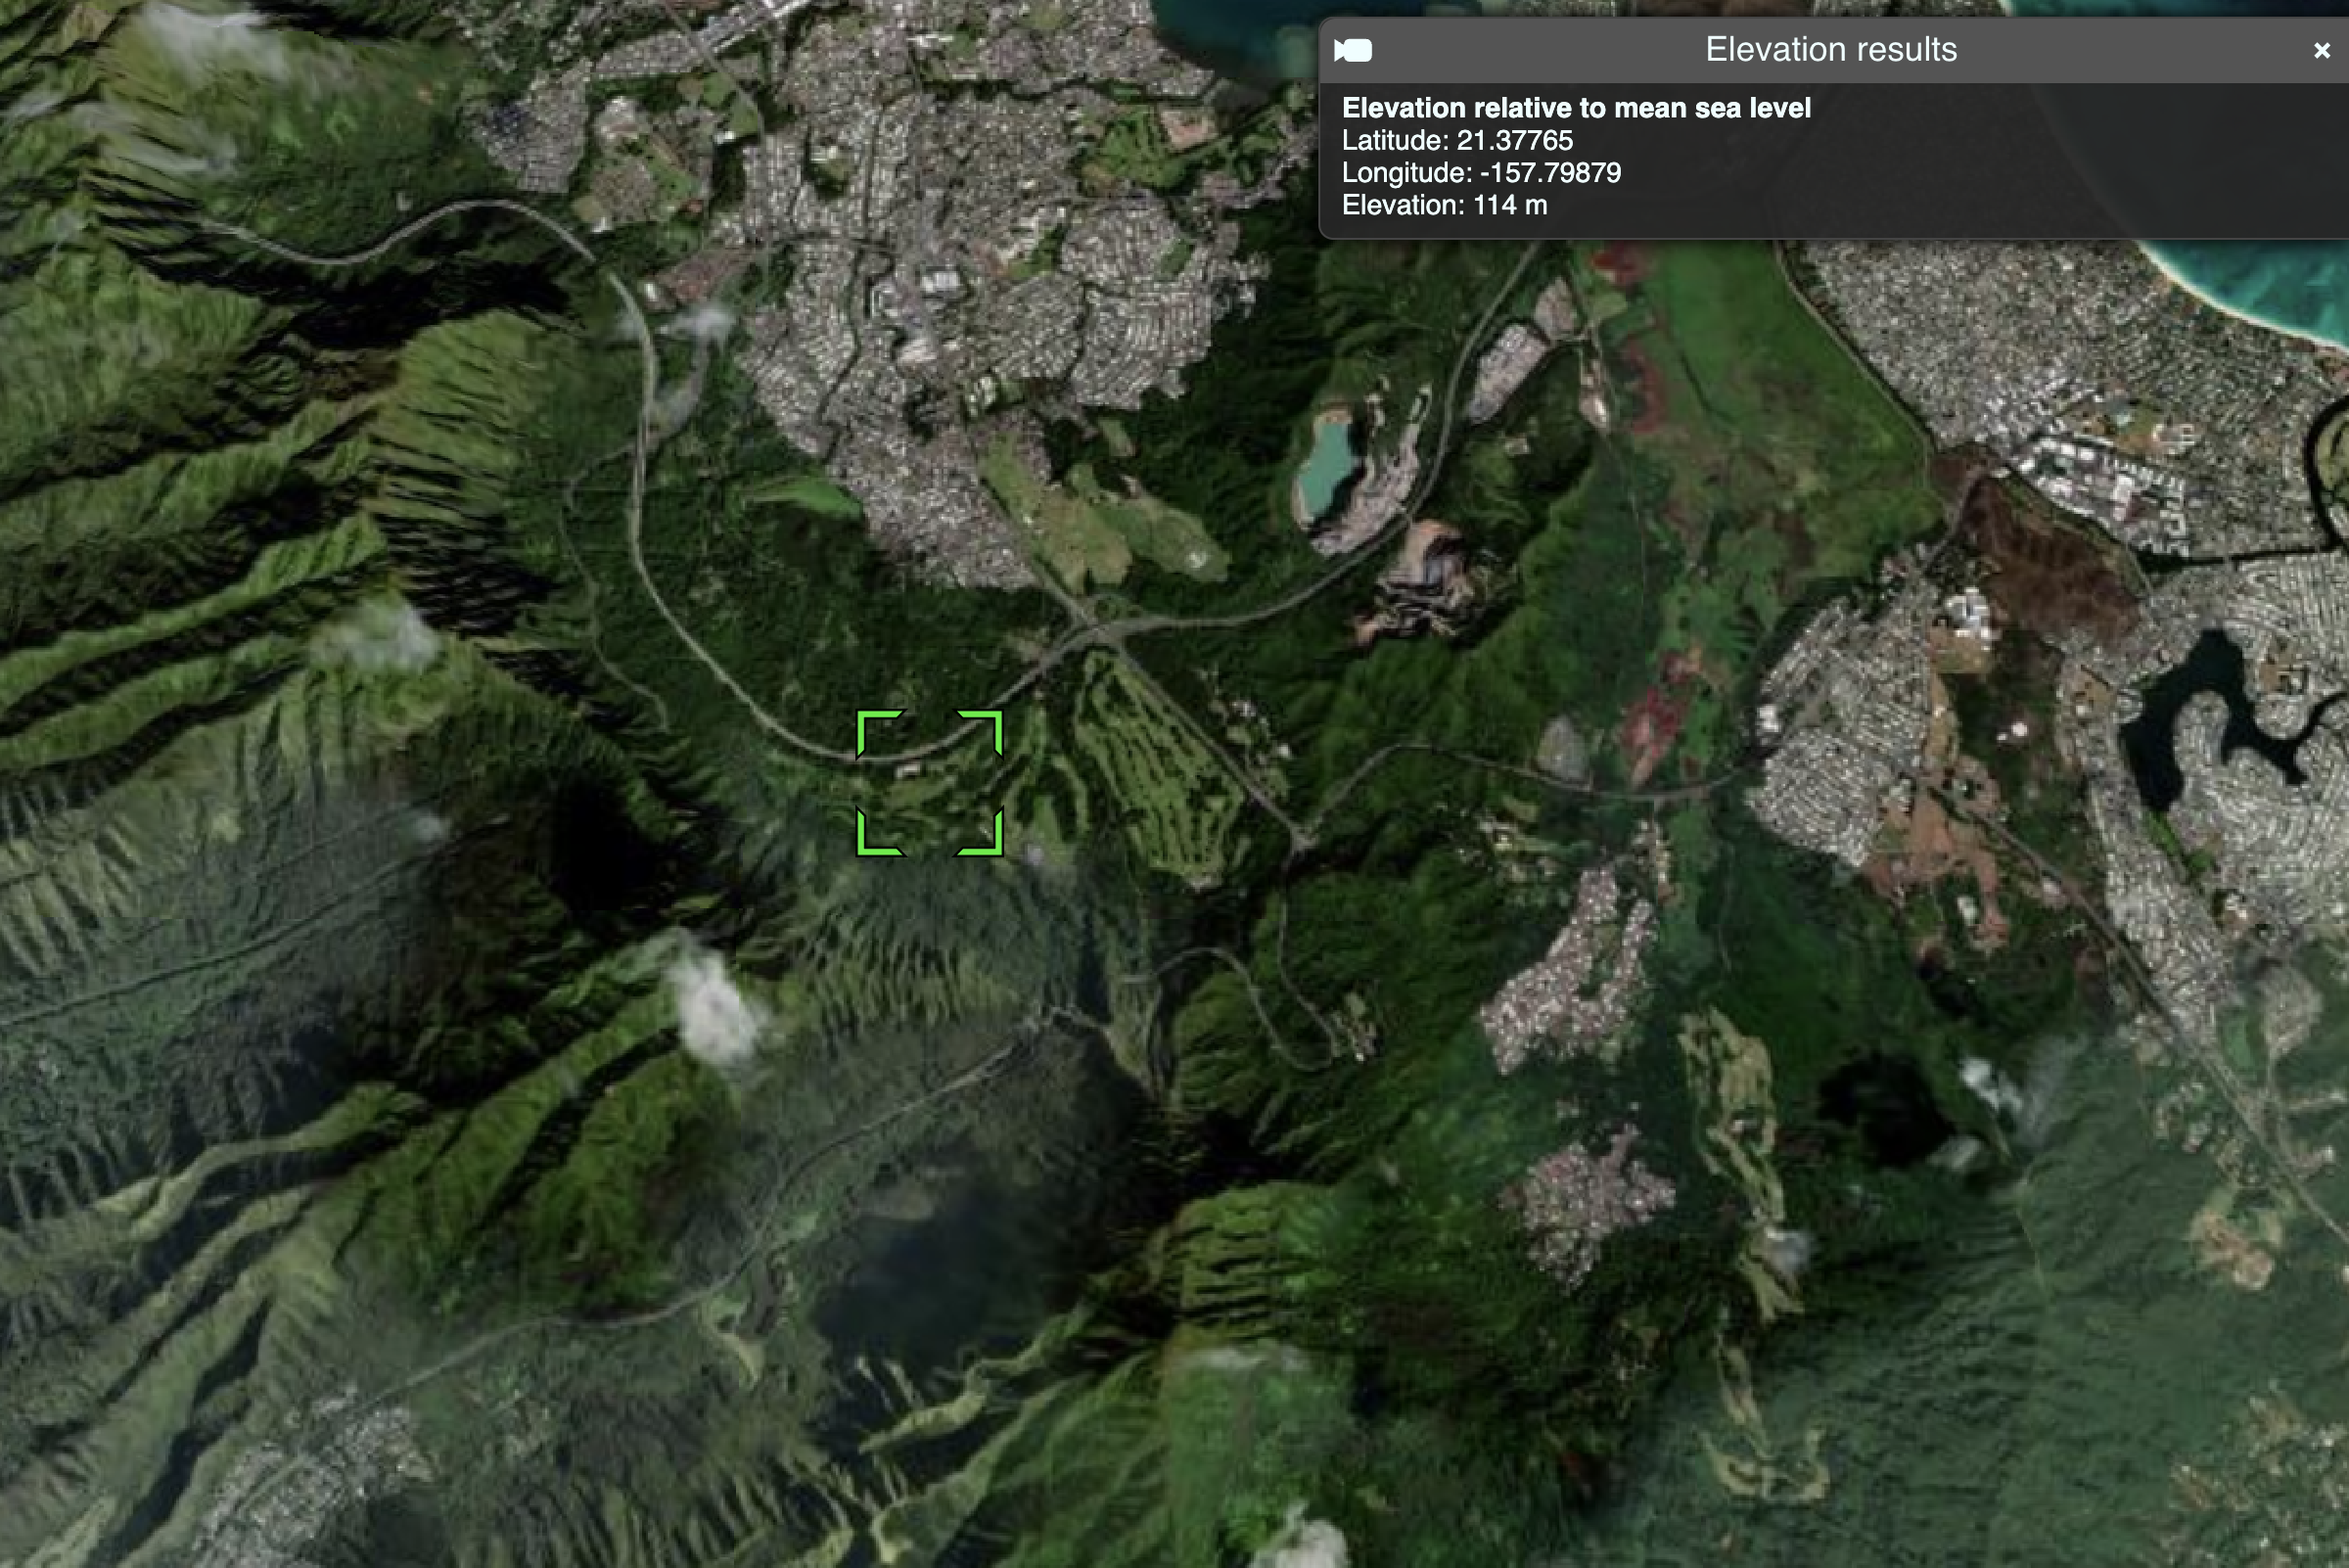
Learn how to find elevation values of points along a path in New Zealand's South Island with the ArcGIS Elevation service
The ArcGIS Elevation service
In this tutorial, use ArcGIS REST JS to access the Elevation service and get elevation values for points along a path in New Zealand's South Island. The values will be returned as measures above mean sea level in meters.
Prerequisites
You need an ArcGIS Location Platform account.
ArcGIS Online and ArcGIS Enterprise accounts are not supported.
Steps
Get the starter app
Select a type of authentication and follow the steps to create a new app.
Choose API key authentication if you:
- Want the easiest way to get started.
- Want to build public applications
A public application is an application that allows anonymous access without requiring users to sign in with an ArcGIS account. It supports API key or app authentication. that access ArcGIS Location ServicesArcGIS Location Services, also referred to as Location Services, are services hosted by Esri that provide geospatial functionality for developing mapping applications. They include the ArcGIS Basemap Styles service, ArcGIS Static Basemap Tiles service, ArcGIS Static Maps service, ArcGIS Places service, ArcGIS Geocoding service, ArcGIS Routing service, ArcGIS GeoEnrichment service, and ArcGIS Elevation service. An ArcGIS Location Platform or ArcGIS Online account is required to use the services. and secure itemsAn item, also known as a content item, is a resource stored in a portal such as a web map, hosted layer, style, script tool, file, or notebook. . - Have an ArcGIS Location Platform or ArcGIS Online account.
Choose user authentication if you:
- Want to build private applications.
- Require application users to sign in with their own ArcGIS account
An ArcGIS account is an identity with a user type and set of privileges that can access specific ArcGIS products, tools, APIs, services, and resources. The main account types that can be used for development are an ArcGIS Location Platform account, ArcGIS Online account, and ArcGIS Enterprise account. ArcGIS Location Platform and ArcGIS Online accounts are also associated with a subscription. and access resources their behalf. - Have an ArcGIS Online account.
To learn more about both types of authentication, go to Authentication.
Set up authentication
Set developer credentials
Add script references
Reference the ArcGIS REST JS request and elevation packages to access the Elevation service.
-
Reference the
requestandelevationpackages from ArcGIS REST JS.Use dark colors for code blocks <script src="https://cesium.com/downloads/cesiumjs/releases/1.146/Build/Cesium/Cesium.js"></script> <link href="https://cesium.com/downloads/cesiumjs/releases/1.146/Build/Cesium/Widgets/widgets.css" rel="stylesheet"> <!-- ArcGIS REST JS --> <script src="https://unpkg.com/@esri/arcgis-rest-request@4/dist/bundled/request.umd.js"></script> <script src="https://unpkg.com/@esri/arcgis-rest-elevation@1/dist/bundled/elevation.umd.js"></script>
Update the map
-
To focus on South Island, New Zealand, update the map's viewpoint to
169.0016, -44.7023and set the scale to20000.Use dark colors for code blocks Copy viewer.camera.setView({ destination: Cesium.Cartesian3.fromDegrees(169.0016, -44.7023, 20000), orientation: { heading: Cesium.Math.toRadians(0.0), pitch: Cesium.Math.toRadians(-70.0) } });
Define points of interest
You need to define the coordinates of interest from Kingston to Frankton in New Zealand's South Island, passing through the Lake Wakatipu. You then draw a polyline connecting these points to visualize the route on the map.
- Define a set of points starting from Kingston, passing through Lake Wakatipu, and reaching Frankton.
Use dark colors for code blocks const points = [ [168.957299, -44.665736], [168.970268, -44.655672], [168.993555, -44.645187], [169.007703, -44.630505], [168.999450, -44.609314], [169.026863, -44.610783], [169.056045, -44.609104] ];
Get elevation data
After defining the points and drawing the route, you make a request to the Elevation service to get the elevations of the points along the route.
-
Define a function called
getand call it.Elevation Data() Use dark colors for code blocks async function getElevationData() { } -
Make a request to the Elevation service, passing in the array of points.
Use dark colors for code blocks async function getElevationData() { const data = await arcgisRest.findElevationAtManyPoints({ coordinates: points, authentication: arcgisRest.ApiKeyManager.fromKey(accessToken) }); }
Display results
Once the elevation data is fetched, you can display the results on the map. This involves extracting the elevation values from the response and creating a pin and popup at each point to show the elevation information.
-
Extract the
x, y, zvalues from the service response to be used for displaying the elevation at each point.Use dark colors for code blocks async function getElevationData() { const data = await arcgisRest.findElevationAtManyPoints({ coordinates: points, authentication: arcgisRest.ApiKeyManager.fromKey(accessToken) }); const elevationData = data.result.points; } -
Use
Pinto place markers on the map at each point, and show a popup with the elevation information when user clicks on it.Builder() Use dark colors for code blocks async function getElevationData() { const data = await arcgisRest.findElevationAtManyPoints({ coordinates: points, authentication: arcgisRest.ApiKeyManager.fromKey(accessToken) }); const elevationData = data.result.points; const pinBuilder = new Cesium.PinBuilder(); const pins = []; points.forEach((point, index) => { const [lng, lat] = point; const { x, y, z } = elevationData[index]; viewer.entities.add({ position: Cesium.Cartesian3.fromDegrees(lng, lat, z + 500), billboard: { verticalOrigin: Cesium.VerticalOrigin.BOTTOM, heightReference: Cesium.HeightReference.CLAMP_TO_GROUND, image: pinBuilder.fromColor(Cesium.Color.BLUE, 48).toDataURL() }, description: `Longitude: ${x}<br/>Latitude: ${y}<br />Elevation: ${z} m`, name: "Elevation relative to mean sea level" }); pins.push(Cesium.Cartesian3.fromDegrees(lng, lat, z + 500)); viewer.screenSpaceEventHandler.setInputAction((movement) => { const pickedObject = viewer.scene.pick(movement.position); if (Cesium.defined(pickedObject)) { viewer.selectedEntity = pickedObject.id; viewer.selectedEntity.description = pickedObject.id.description; } }, Cesium.ScreenSpaceEventType.LEFT_CLICK); }); viewer.entities.add({ polyline: { positions: pins, material: Cesium.Color.BLUE } }); }
Run the app
Run the app.
You should now see a map centered over the New Zealand's South Island, displaying the path between Kingston to Frankton, passing through the Lake Wakatipu, with elevation values along the route.What's next?
Learn how to use additional location services in these tutorials: