CesiumJS applications can access data services hosted in a portal. You can access data services to display features, map tiles, or 3D objects such as buildings. Supported data types include features, I3S data, and map tiles.
All data stored in ArcGIS is managed and accessed as a data service. You can create a data service by uploading your own data to ArcGIS. Data services are managed through an item and can be accessed in your application by referencing their service URL.
Feature data
If you have features containing geometry and attributes, you can import the data to create an ArcGIS feature layer in a feature service. To access the data, you can use the URL of the service to query and return features. You can style and display the results in a map or scene. Feature layers can also contain styling information as part of the service response.
How to access a feature service
To display features from a feature service in CesiumJS, you need to use ArcGIS REST JS to query the features and return results as GeoJSON. Once you have the GeoJSON response, use a Cesium Geo to add and style the feature data.
-
Create a new feature service in your portal or select an existing one. You can create a feature service by uploading a CSV, XLS, GeoJSON, or shapefile.
-
In your CesiumJS application, add references to the ArcGIS REST JS
requestandfeature-servicepackages. -
Create an
authenticationobject with ArcGIS REST JS using your ArcGIS access token. If the feature service is private, ensure that your access token is properly scoped to access the features. -
Use
arcgisto request features from the feature service. Set theRest.query Features urlparameter to the URL of the feature service, and includef:to return results as GeoJSON."geojson" -
Create a new
Cesium.Geofrom the ArcGIS REST JS response.Json Data Source -
Add the GeoJSON data source to your scene using
data.Sources.add
Example
Add a trailhead (points) layer
This example queries the Santa Monica Trailheads (points) feature layer and adds the results to the scene as a Geo.
<div id="cesiumContainer"></div>
<script>
const viewer = new Cesium.Viewer("cesiumContainer", {
imageryProvider: arcGISImageTileProvider,
});
const pointLayerURL = "https://services3.arcgis.com/GVgbJbqm8hXASVYi/arcgis/rest/services/Trailheads/FeatureServer/0";
arcgisRest.queryFeatures({
url: pointLayerURL,
authentication,
f:"geojson"
}).then((response) => {
const data = Cesium.GeoJsonDataSource.load(response,{
clampToGround:true
})
viewer.dataSources.add(data);
})
</script>Scene data
A scene service contains 3D scene data stored in the Indexed 3D Scene Layer (I3S) format, an OGC standard. Cesium currently supports the following types of I3S layers:
How to access a scene service
To display scene data in CesiumJS, add an I3SData to your app that references the URL of the scene service.
-
Create a scene service in ArcGIS by uploading a scene layer package, or find an existing scene layer from ArcGIS Living Atlas.
-
In your CesiumJS application, create a new
I3SData. Set theProvider urlto the URL of the scene service. -
If your layer has gravity-related heights, set the
geoidparameter of theTiled Terrain Provider I3SDatato an Earth Gravitational Model.Provider -
Add the I3S data provider to your scene using
scene.primitives.add.
Example
Add a 3D object layer of San Francisco
This example displays a 3D object layer containing textured building models of San Francisco. It uses the Earth Gravitational Model EGM2008 to align buildings with terrain.
<div id="cesiumContainer"></div>
<script type="module">
const accessToken = "YOUR_ACCESS_TOKEN";
Cesium.ArcGisMapService.defaultAccessToken = accessToken;
const cesiumAccessToken = "YOUR_CESIUM_ACCESS_TOKEN";
Cesium.Ion.defaultAccessToken = cesiumAccessToken;
const arcGisImagery = Cesium.ArcGisMapServerImageryProvider.fromBasemapType(Cesium.ArcGisBaseMapType.SATELLITE, {
enablePickFeatures:false
});
const viewer = new Cesium.Viewer("cesiumContainer", {
baseLayer: Cesium.ImageryLayer.fromProviderAsync(arcGisImagery),
});
// The source data used in this transcoding service was compiled from https://earth-info.nga.mil/#tab_wgs84-data and is based on EGM2008 Gravity Model
const geoidService = await Cesium.ArcGISTiledElevationTerrainProvider.fromUrl("https://tiles.arcgis.com/tiles/z2tnIkrLQ2BRzr6P/arcgis/rest/services/EGM2008/ImageServer");
const i3sLayer = "https://tiles.arcgis.com/tiles/z2tnIkrLQ2BRzr6P/arcgis/rest/services/SanFrancisco_3DObjects_1_7/SceneServer";
const i3sProvider = await Cesium.I3SDataProvider.fromUrl(i3sLayer, {
geoidTiledTerrainProvider: geoidService,
token: accessToken
})
viewer.scene.primitives.add(i3sProvider);
</script>
Map tiles
You can add an ArcGIS map tile layer to a CesiumJS application to visualize your data. Map tiles can be accessed through the ArcGISMap class.
How to access a map tile service
-
In ArcGIS, create a map tile service by publishing one from an existing feature layer, or by importing a tile package.
-
In your CesiumJS application, create a
ViewerorCesium.Widget -
Create a new
ArcGISMapand set theServer Imagery Provider urlto the URL of the map tile service. Set thetokenparameter to your ArcGIS access token. -
Display the map tiles in your scene by adding the provider to the viewer's
Imagery.Layer Collection
Example
Add map tiles
This example shows how to add a custom map tile layer hosted in a portal to your CesiumJS application.
<div id="cesiumContainer"></div>
<script>
const accessToken = "YOUR_ACCESS_TOKEN";
Cesium.ArcGisMapService.defaultAccessToken = accessToken;
const cesiumAccessToken = "YOUR_CESIUM_ACCESS_TOKEN";
Cesium.Ion.defaultAccessToken = cesiumAccessToken;
const arcGisImagery = Cesium.ArcGisMapServerImageryProvider.fromBasemapType(Cesium.ArcGisBaseMapType.SATELLITE, {
enablePickFeatures:false
});
const viewer = new Cesium.Viewer("cesiumContainer", {
baseLayer: Cesium.ImageryLayer.fromProviderAsync(arcGisImagery),
});
const santaMonicaParcels = Cesium.ArcGisMapServerImageryProvider.fromUrl("https://tiles.arcgis.com/tiles/P3ePLMYs2RVChkJx/arcgis/rest/services/WV03_Kilauea_20180519_ShortwaveInfrared/MapServer", {
token:accessToken
});
viewer.scene.imageryLayers.add(
Cesium.ImageryLayer.fromProviderAsync(santaMonicaParcels)
);
</script>
Tutorials
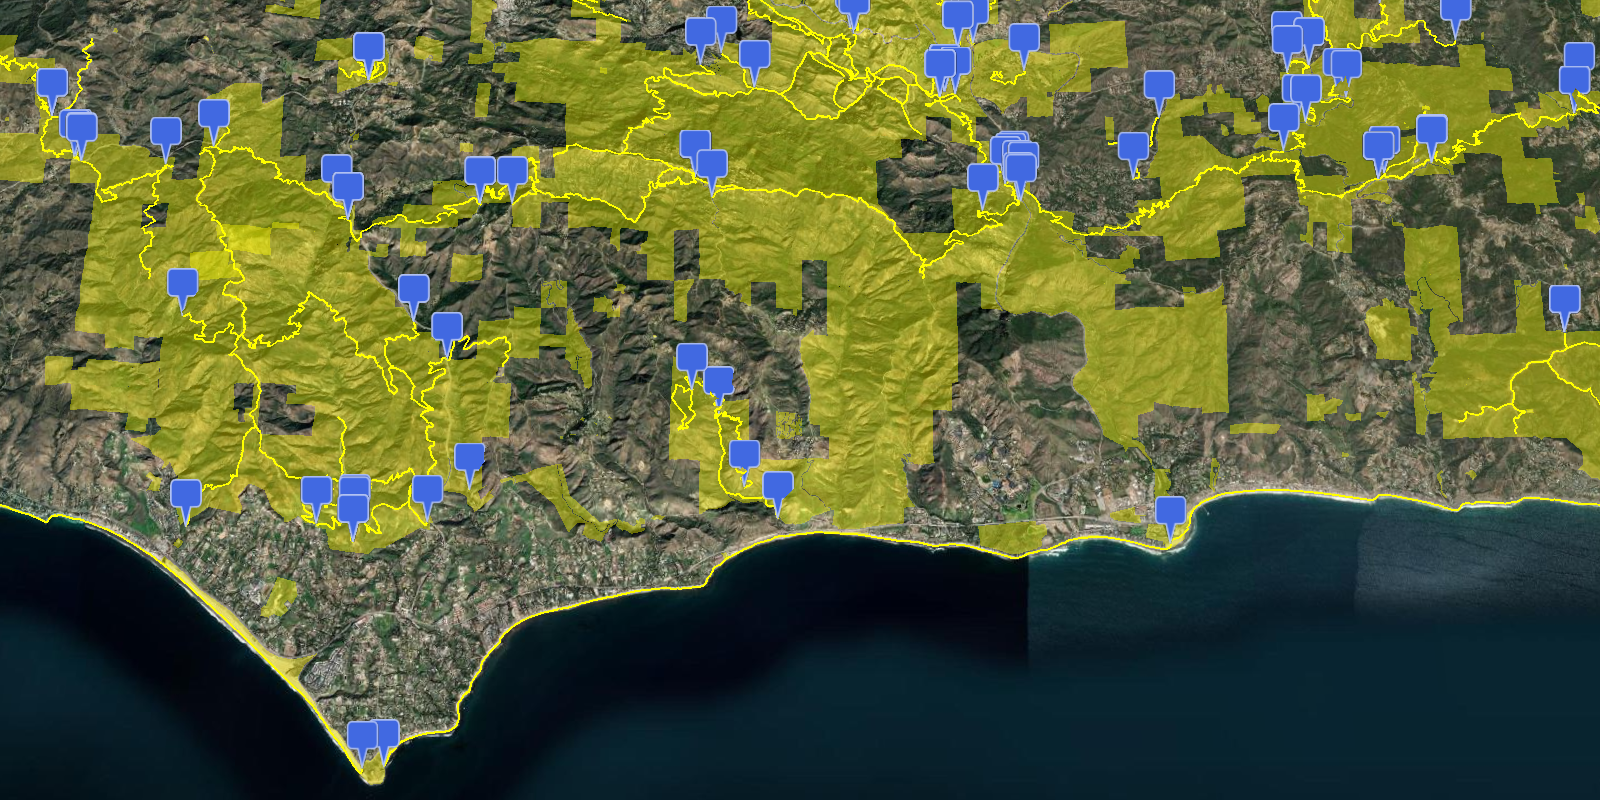
Add features as GeoJSON
Add features from a feature service to a scene.
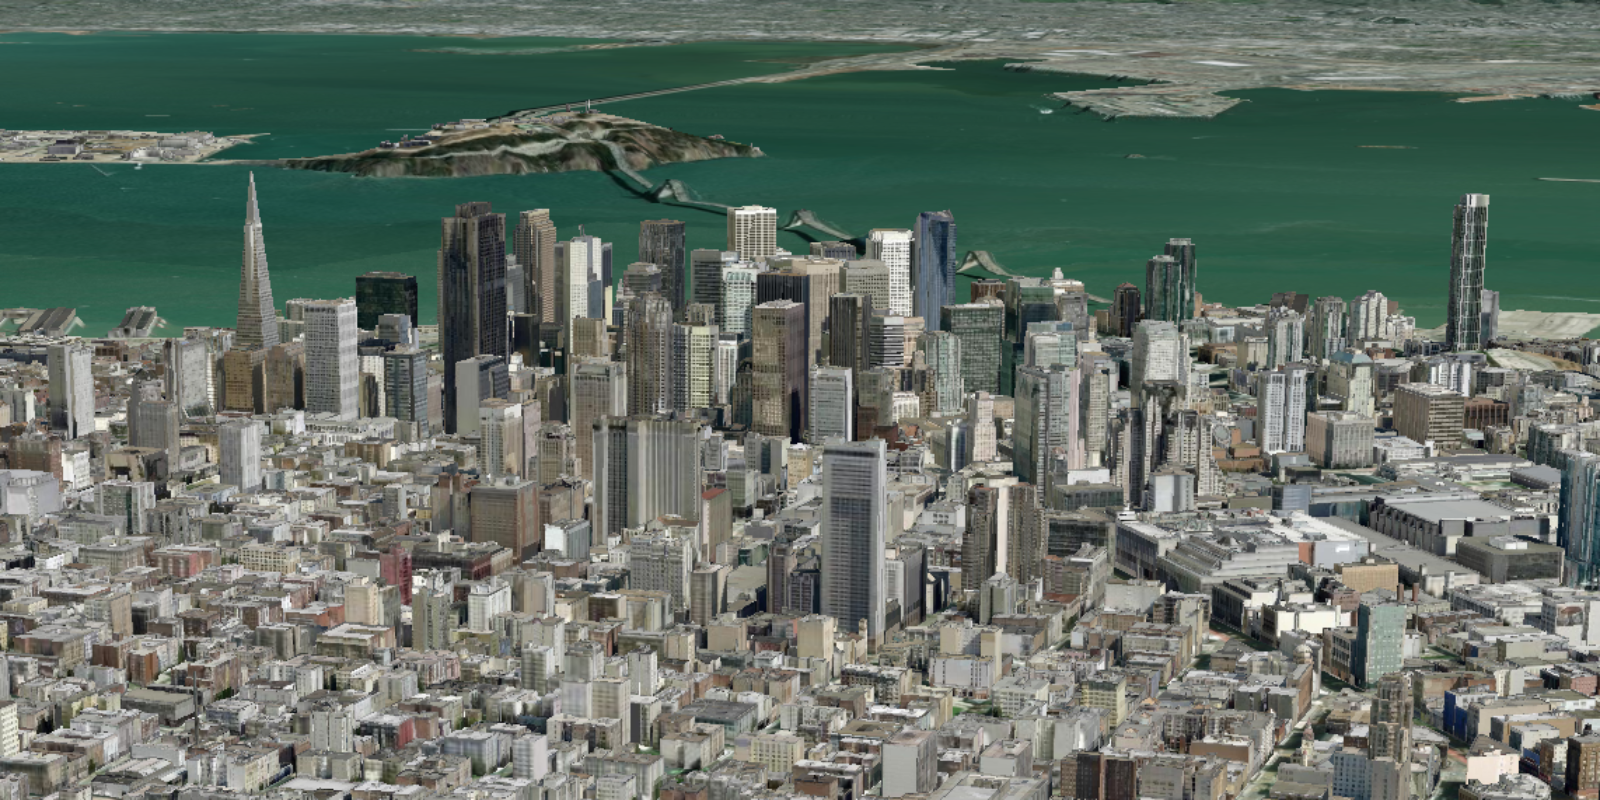
Add 3D objects
Add 3D objects from a scene service to a scene.
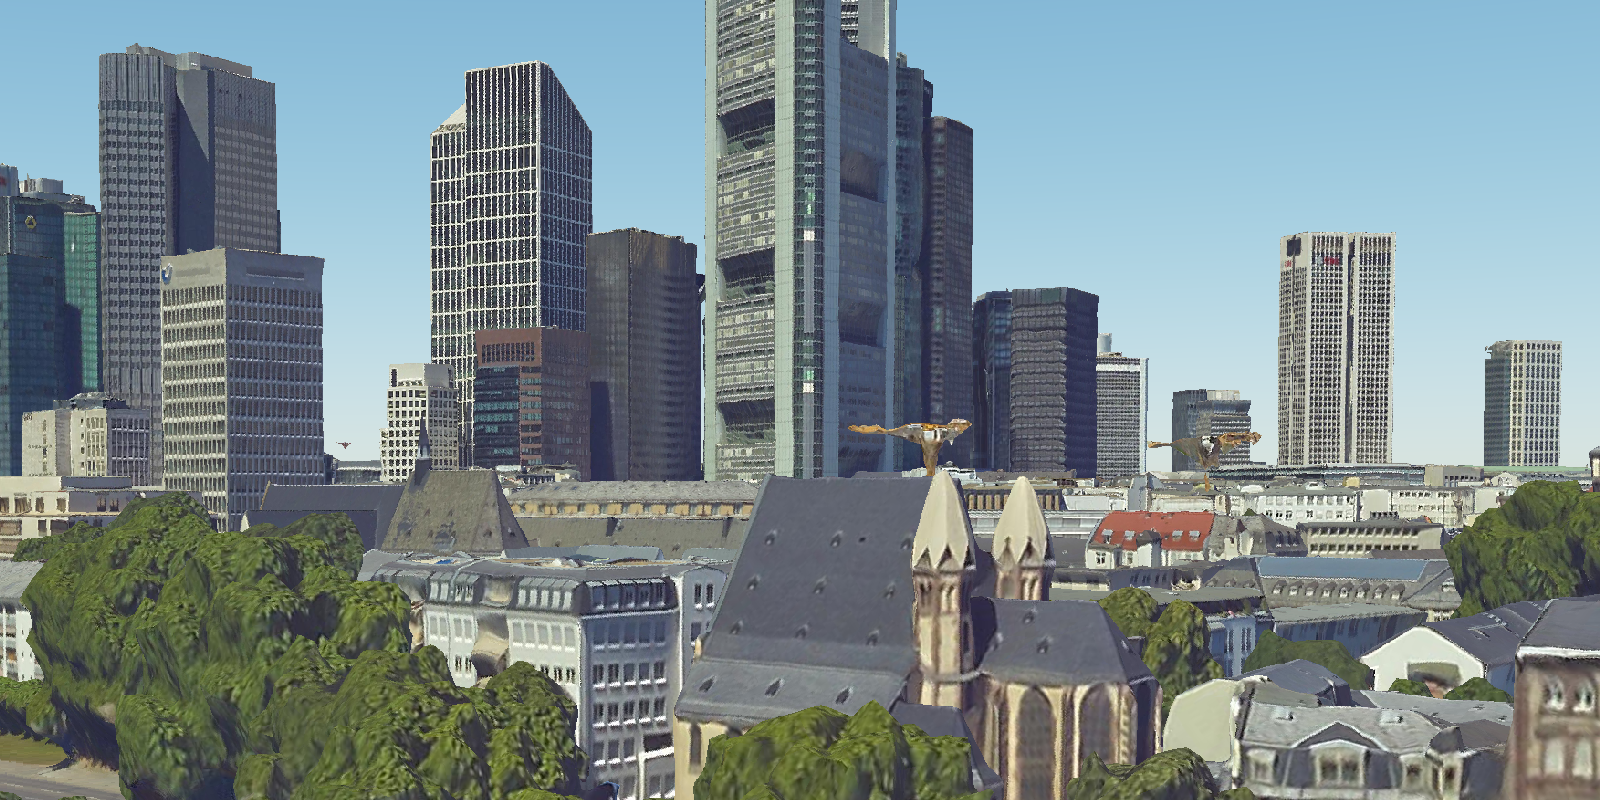
Add an integrated mesh
Add a textured mesh from a scene service to a scene.
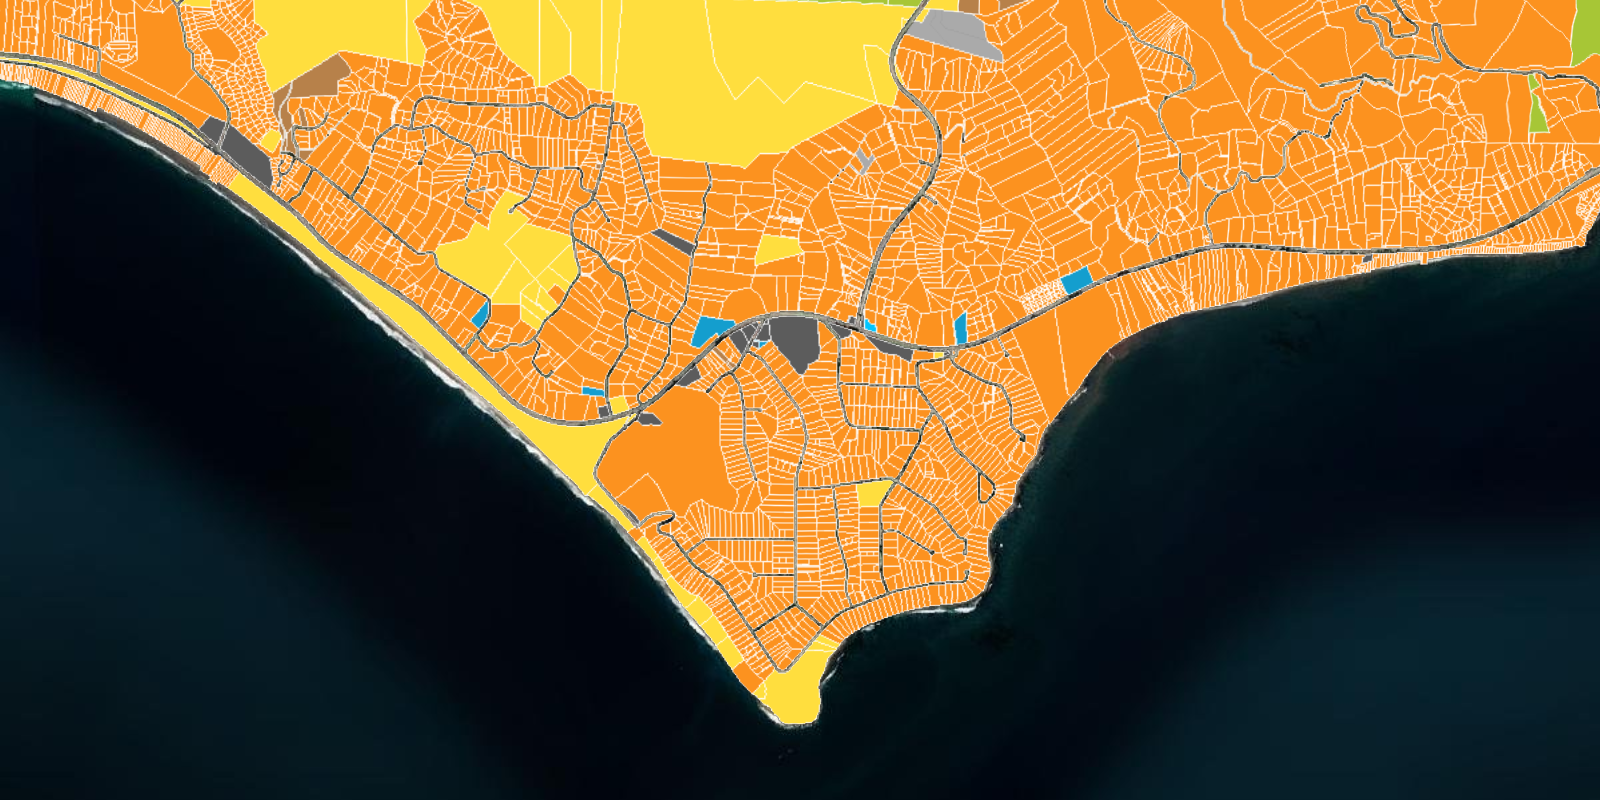
Add map tiles
Add map tiles from a map tile service to a scene.
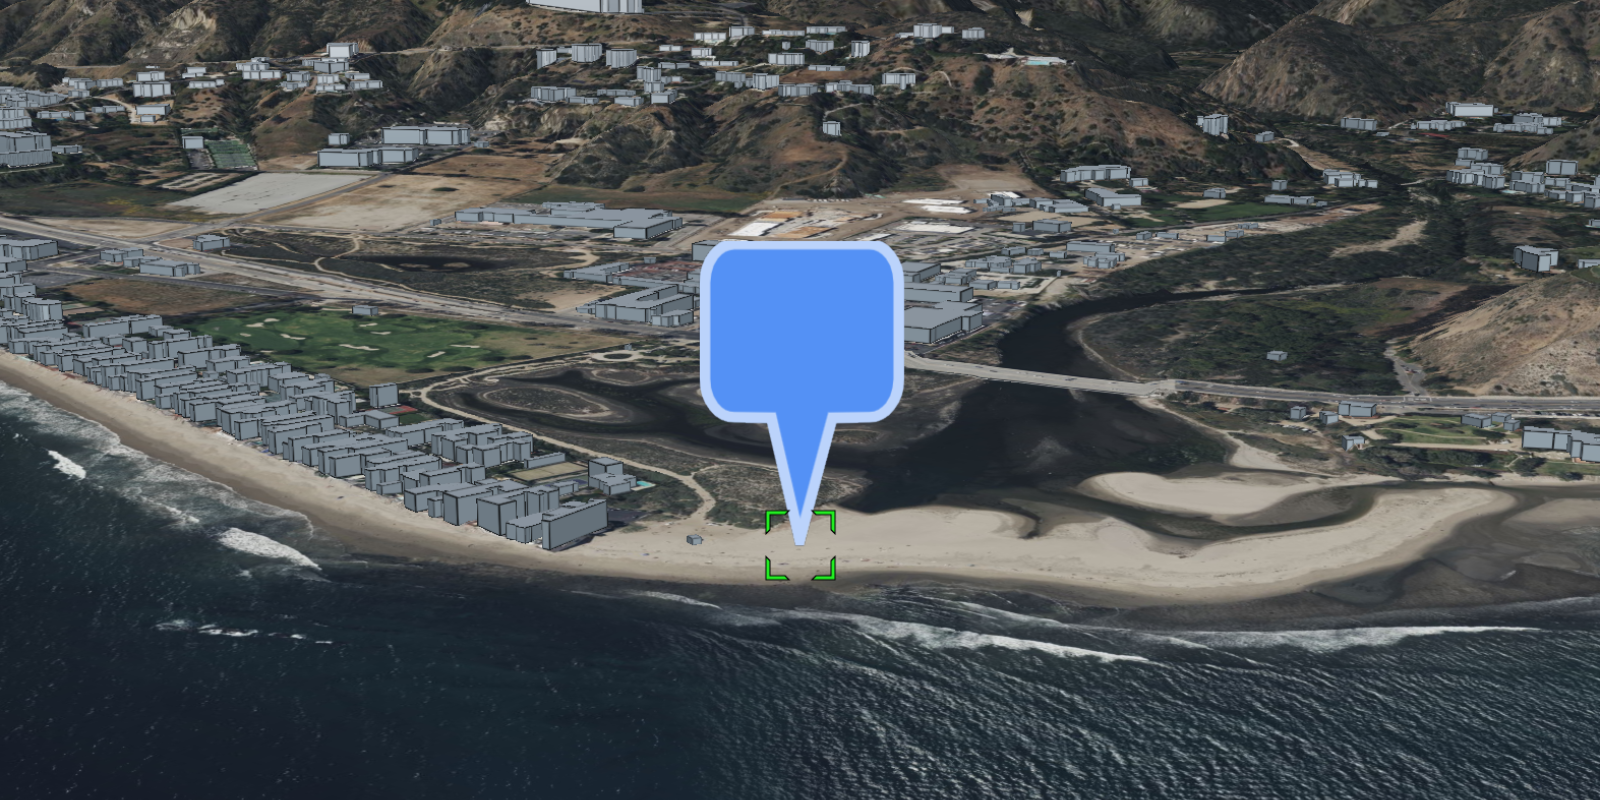
Display a pop-up (Feature)
Display feature attributes in a popup.
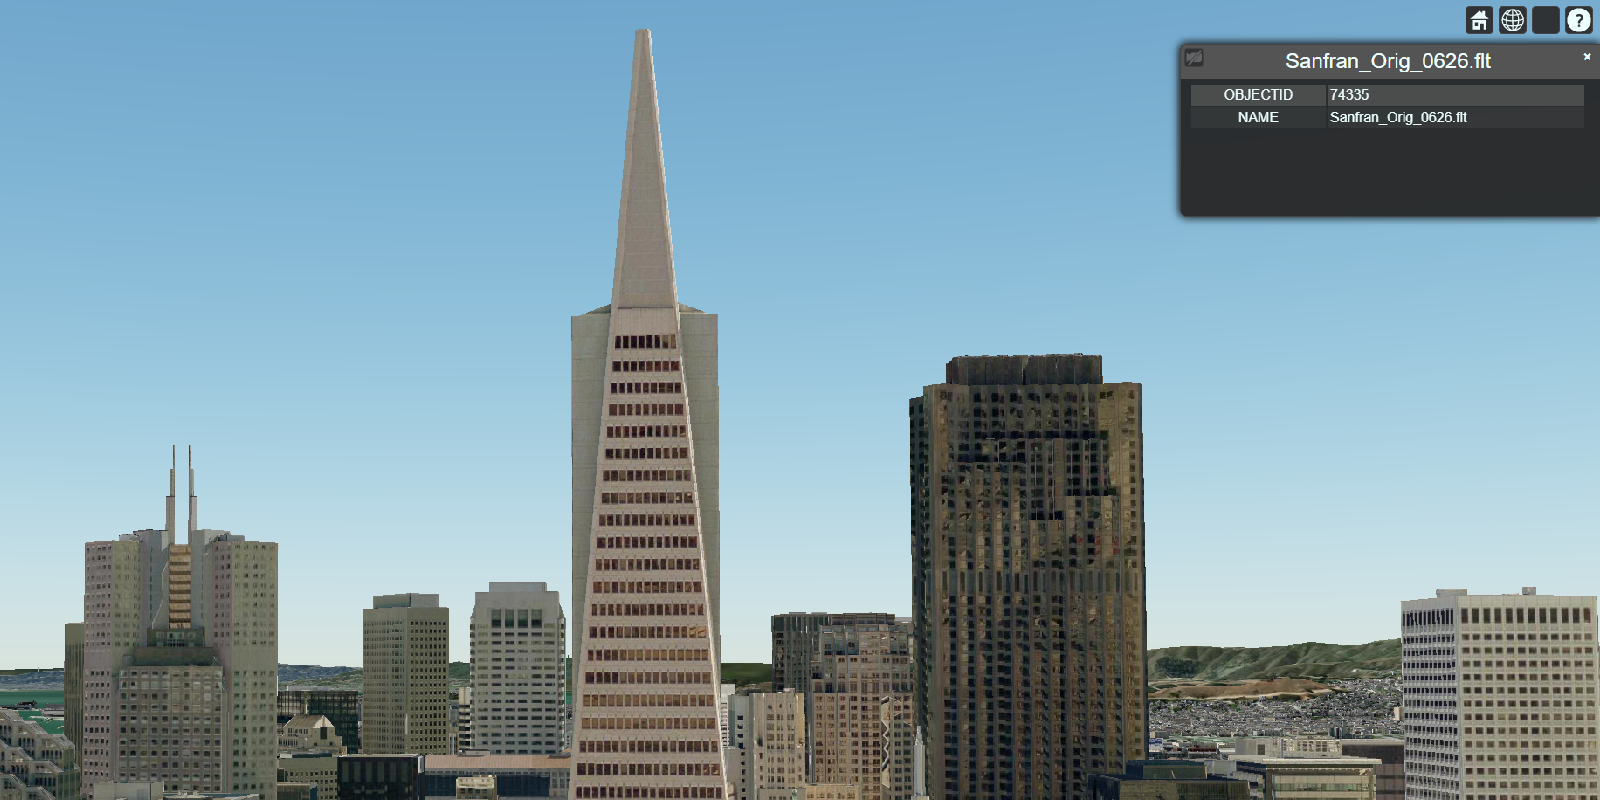
Display a pop-up (I3S)
Display I3S attributes in a popup.