Learn how to find a route and directions with the route service.
Routing is the process of finding the path from an origin to a destination in a street network. You can use the route service to find routes, get driving directions, calculate drive times, and solve complicated, multiple vehicle routing problems. To create a route, you typically define a set of stops (origin and one or more destinations) and use the service to find a route with directions. You can also use a number of additional parameters such as barriers and mode of travel to refine the results.
In this tutorial, you define an origin and destination by clicking on the map. These values are used to get a route and directions from the route service. The directions are also displayed on the map.
Prerequisites
You need an ArcGIS Location Platform or ArcGIS Online account.
Steps
Create a new pen
- To get started, either complete the Display a scene tutorial or .
Get an access token
You need an access token with the correct privileges to access the resources used in this tutorial.
-
Go to the Create an API key tutorial and create an API key with the following privilege(s):
- Privileges
- Location services > Basemaps
- Location services > Routing
- Privileges
-
Copy the API key access token to your clipboard when prompted.
-
In CodePen, update the
accessvariable to use your access token.Token Use dark colors for code blocks const accessToken = "YOUR_ACCESS_TOKEN"; Cesium.ArcGisMapService.defaultAccessToken = accessToken; const cesiumAccessToken = "YOUR_CESIUM_ACCESS_TOKEN"; Cesium.Ion.defaultAccessToken = cesiumAccessToken; const arcGisImagery = Cesium.ArcGisMapServerImageryProvider.fromBasemapType(Cesium.ArcGisBaseMapType.SATELLITE); const viewer = new Cesium.Viewer("cesiumContainer", { baseLayer: Cesium.ImageryLayer.fromProviderAsync(arcGisImagery), });
To learn about the other types of authentication available, go to Types of authentication.
Add references to ArcGIS REST JS
-
In the
<headelement, reference the> routingandrequestpackages from ArcGIS REST JS.Use dark colors for code blocks <script src="https://cesium.com/downloads/cesiumjs/releases/1.121/Build/Cesium/Cesium.js"></script> <link href="https://cesium.com/downloads/cesiumjs/releases/1.121/Build/Cesium/Widgets/widgets.css" rel="stylesheet"> <script src="https://unpkg.com/@esri/arcgis-rest-request@4/dist/bundled/request.umd.js"></script> <script src="https://unpkg.com/@esri/arcgis-rest-routing@4/dist/bundled/routing.umd.js"></script>
Update the scene
This routing application uses an integrated mesh layer of Frankfurt, Germany. Update the scene extent to focus on Frankfurt.
-
Update the
setcommand to center on locationView [8.68019, 50.1147], Frankfurt.Use dark colors for code blocks viewer.camera.setView({ destination : Cesium.Cartesian3.fromDegrees(8.68019, 50.1147 , 500), orientation : { heading: Cesium.Math.toRadians(-120), pitch : Cesium.Math.toRadians(-28.0), } }); -
Add the Frankfurt integrated mesh layer to the scene as an
I3.S Data Provider Use dark colors for code blocks viewer.camera.setView({ destination : Cesium.Cartesian3.fromDegrees(8.68019, 50.1147 , 500), orientation : { heading: Cesium.Math.toRadians(-120), pitch : Cesium.Math.toRadians(-28.0), } }); const geoidService = await Cesium.ArcGISTiledElevationTerrainProvider.fromUrl("https://tiles.arcgis.com/tiles/GVgbJbqm8hXASVYi/arcgis/rest/services/EGM2008/ImageServer"); const i3sProvider = await Cesium.I3SDataProvider.fromUrl("https://tiles.arcgis.com/tiles/cFEFS0EWrhfDeVw9/arcgis/rest/services/Buildings_Frankfurt_2021/SceneServer", { geoidTiledTerrainProvider: geoidService, token: accessToken }) viewer.scene.primitives.add(i3sProvider);
Create start and end point graphics
Billboard entities are used to represent the start and end points of the route. You can customize Billboard entities to display custom pins and images.
-
Add two new
Billboardentities to the viewer to represent start and end points. Set thepositionof both entities tonull.Use dark colors for code blocks const geoidService = await Cesium.ArcGISTiledElevationTerrainProvider.fromUrl("https://tiles.arcgis.com/tiles/GVgbJbqm8hXASVYi/arcgis/rest/services/EGM2008/ImageServer"); const i3sProvider = await Cesium.I3SDataProvider.fromUrl("https://tiles.arcgis.com/tiles/cFEFS0EWrhfDeVw9/arcgis/rest/services/Buildings_Frankfurt_2021/SceneServer", { geoidTiledTerrainProvider: geoidService, token: accessToken }) viewer.scene.primitives.add(i3sProvider); const startPoint = viewer.entities.add({ name:'start', position:null, billboard: { verticalOrigin: Cesium.VerticalOrigin.BOTTOM, heightReference: Cesium.HeightReference.CLAMP_TO_GROUND, } }) const endPoint = viewer.entities.add({ name:'end', position:null, billboard: { verticalOrigin: Cesium.VerticalOrigin.BOTTOM, heightReference: Cesium.HeightReference.CLAMP_TO_GROUND, } }) -
Create a
Pinand use it to set theBuilder imageproperty of the billboards.Use dark colors for code blocks const pinBuilder = new Cesium.PinBuilder(); const startPoint = viewer.entities.add({ name:'start', position:null, billboard: { verticalOrigin: Cesium.VerticalOrigin.BOTTOM, heightReference: Cesium.HeightReference.CLAMP_TO_GROUND, image: pinBuilder.fromText("1",Cesium.Color.fromCssColorString('#348bdb'),48).toDataURL(), } }) const endPoint = viewer.entities.add({ name:'end', position:null, billboard: { verticalOrigin: Cesium.VerticalOrigin.BOTTOM, heightReference: Cesium.HeightReference.CLAMP_TO_GROUND, image: pinBuilder.fromText("2",Cesium.Color.fromCssColorString('#348bdb'),48).toDataURL(), } })
Add a click handler
Use an event handler to set the start (origin) and end (destination) points for the route. The first click will set the start for the route and the second click will set the end. Subsequent clicks will start a new route.
-
Create a
currentvariable initialized toStep 'start'. DeclarestartandCoords endvariables that will be used within the click handler.Coords Use dark colors for code blocks const geoidService = await Cesium.ArcGISTiledElevationTerrainProvider.fromUrl("https://tiles.arcgis.com/tiles/GVgbJbqm8hXASVYi/arcgis/rest/services/EGM2008/ImageServer"); const i3sProvider = await Cesium.I3SDataProvider.fromUrl("https://tiles.arcgis.com/tiles/cFEFS0EWrhfDeVw9/arcgis/rest/services/Buildings_Frankfurt_2021/SceneServer", { geoidTiledTerrainProvider: geoidService, token: accessToken }) viewer.scene.primitives.add(i3sProvider); let currentStep = 'start'; let startCoords,endCoords; const pinBuilder = new Cesium.PinBuilder(); -
Create a
Screenfor theSpace Event Handler Viewerthat listens for left clicks. Create anonfunction that runs when a click is detected.Left Click Use dark colors for code blocks const endPoint = viewer.entities.add({ name:'end', position:null, billboard: { verticalOrigin: Cesium.VerticalOrigin.BOTTOM, heightReference: Cesium.HeightReference.CLAMP_TO_GROUND, image: pinBuilder.fromText("2",Cesium.Color.fromCssColorString('#348bdb'),48).toDataURL(), } }) function onLeftClick(movement) { } viewer.screenSpaceEventHandler.setInputAction(onLeftClick,Cesium.ScreenSpaceEventType.LEFT_CLICK); -
Get the coordinates of the clicked location and use transform them from
Cartesiancoordinates to longitude and latitude degrees to use with the routing service.Use dark colors for code blocks function onLeftClick(movement) { const pickedPosition = viewer.scene.pickPosition(movement.position); const cartographic = Cesium.Cartographic.fromCartesian(pickedPosition); const point = [Cesium.Math.toDegrees(cartographic.longitude),Cesium.Math.toDegrees(cartographic.latitude)] } viewer.screenSpaceEventHandler.setInputAction(onLeftClick,Cesium.ScreenSpaceEventType.LEFT_CLICK); -
Set the locations of the
startandPoint endbillboards using a conditional statement. When a new starting position is set, remove all previous billboards and routes.Point Use dark colors for code blocks function onLeftClick(movement) { const pickedPosition = viewer.scene.pickPosition(movement.position); const cartographic = Cesium.Cartographic.fromCartesian(pickedPosition); const point = [Cesium.Math.toDegrees(cartographic.longitude),Cesium.Math.toDegrees(cartographic.latitude)] if (currentStep === 'start') { startCoords = point; startPoint.position = pickedPosition; viewer.dataSources.removeAll(); endPoint.position = null; endCoords = null; currentStep = 'end'; } else { endCoords = point; endPoint.position = pickedPosition; currentStep = 'start'; } } viewer.screenSpaceEventHandler.setInputAction(onLeftClick,Cesium.ScreenSpaceEventType.LEFT_CLICK); -
Run the app. You should be able to click on the map to create two billboards that display the numbers "1" and "2". Subsequent clicks should set new positions for the billboards.
Get the route and directions
To find a route between the points as well as turn-by-turn directions, use the ArcGIS REST JS solve function to make a request to the routing service.
-
Create a new
arcgisand set your access token.Rest. Api Key Manager Use dark colors for code blocks const accessToken = "YOUR_ACCESS_TOKEN"; Cesium.ArcGisMapService.defaultAccessToken = accessToken; const authentication = arcgisRest.ApiKeyManager.fromKey(accessToken); -
Create a function called
getthat accepts two sets of coordinate pairs. Inside, callRoute arcgisand provide the coordinates of the starting and ending points.Rest.solve Route arcgiscreates a direct request to theRest.solve Route solveendpoint of the routing service. To learn more about thesolveendpoint, go to Routing service in the Mapping and location services guide.Use dark colors for code blocks viewer.screenSpaceEventHandler.setInputAction(onLeftClick,Cesium.ScreenSpaceEventType.LEFT_CLICK); function getRoute(start,end) { arcgisRest .solveRoute({ stops: [start,end], authentication }) } -
Access the service response and add the returned GeoJSON to your application as a
Geo.Json Data Source Use dark colors for code blocks function getRoute(start,end) { arcgisRest .solveRoute({ stops: [start,end], authentication }) .then((response) => { Cesium.GeoJsonDataSource.load(response.routes.geoJson,{ stroke:Cesium.Color.fromCssColorString('#76fcfc'), strokeWidth:5, clampToGround:true }).then((data)=>{ viewer.dataSources.add(data); }); }) } -
Access the
directionsreturned by the service and format them as HTML. Create an invisibleEntityand set itsdescriptionto display directions on the map.Use dark colors for code blocks function getRoute(start,end) { arcgisRest .solveRoute({ stops: [start,end], authentication }) .then((response) => { Cesium.GeoJsonDataSource.load(response.routes.geoJson,{ stroke:Cesium.Color.fromCssColorString('#76fcfc'), strokeWidth:5, clampToGround:true }).then((data)=>{ viewer.dataSources.add(data); }); const directionsHTML = response.directions[0].features.map((f) => f.attributes.text).join("<br/>"); const directionsPopup = viewer.entities.add({ name:"Directions", description:directionsHTML, position:Cesium.Cartesian3.fromDegrees(0,0), }); viewer.selectedEntity = directionsPopup; }) } -
In your
onfunction, callLeft Click getwhen both a start point and end point have been set.Route Use dark colors for code blocks function onLeftClick(movement) { const pickedPosition = viewer.scene.pickPosition(movement.position); const cartographic = Cesium.Cartographic.fromCartesian(pickedPosition); const point = [Cesium.Math.toDegrees(cartographic.longitude),Cesium.Math.toDegrees(cartographic.latitude)] if (currentStep === 'start') { startCoords = point; startPoint.position = pickedPosition; viewer.dataSources.removeAll(); endPoint.position = null; endCoords = null; currentStep = 'end'; } else { endCoords = point; endPoint.position = pickedPosition; currentStep = 'start'; } if (startCoords && endCoords) { getRoute(startCoords,endCoords); } } viewer.screenSpaceEventHandler.setInputAction(onLeftClick,Cesium.ScreenSpaceEventType.LEFT_CLICK);
Run the app
In CodePen, run your code to display the map.
When the application loads, you should be able to click on two different locations to create an origin point and a destination. The routing service should then calculate a driving route between them.
What's next?
Learn how to use additional ArcGIS location services in these tutorials:
Find service areas
Calculate the area that can be reached in a given driving time from a location.
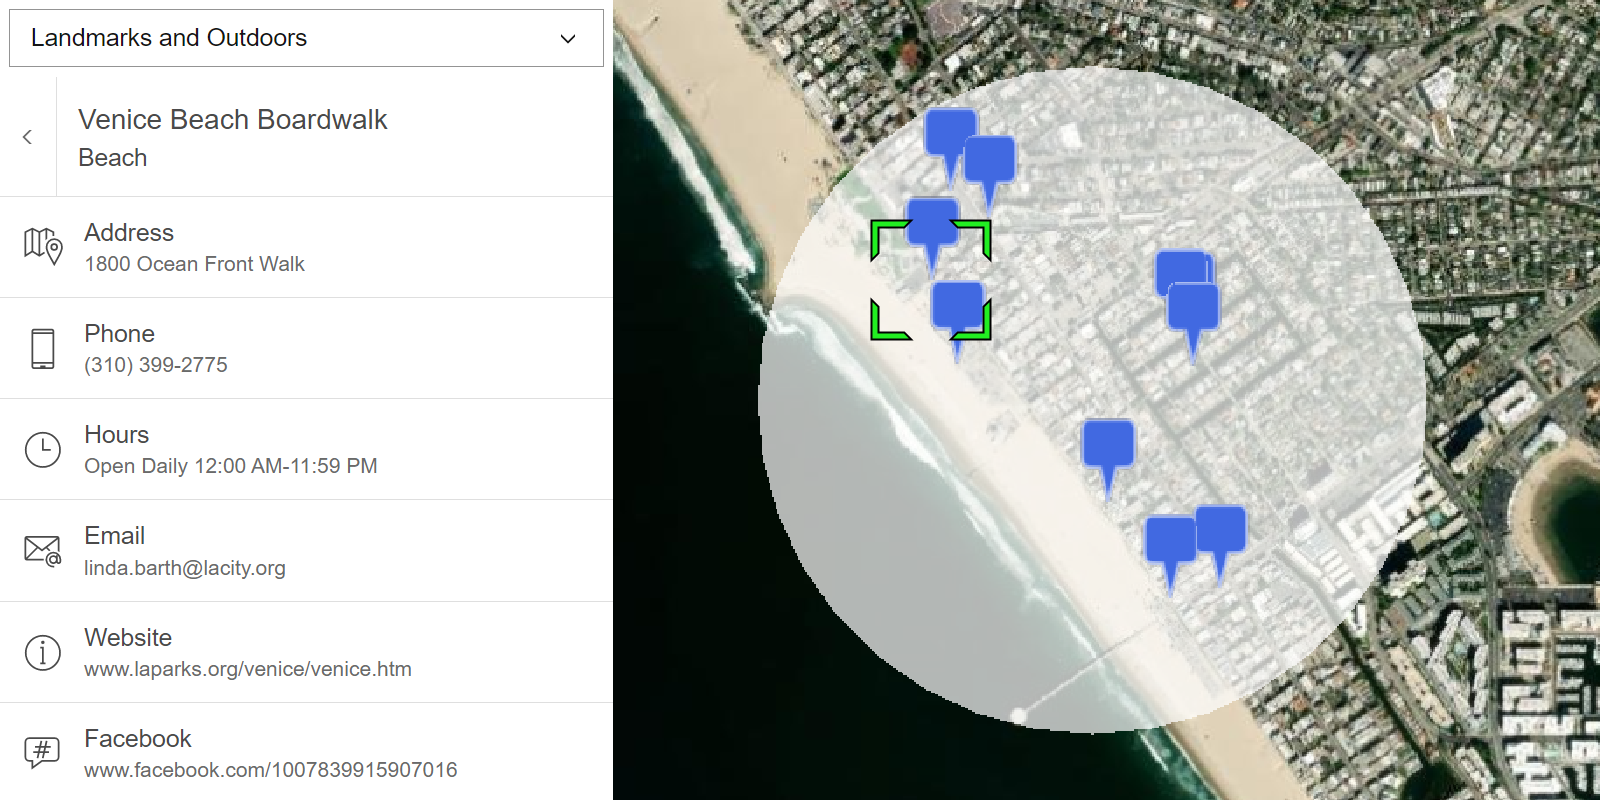
Find nearby places and details
Find points of interest near a location and get detailed information about them
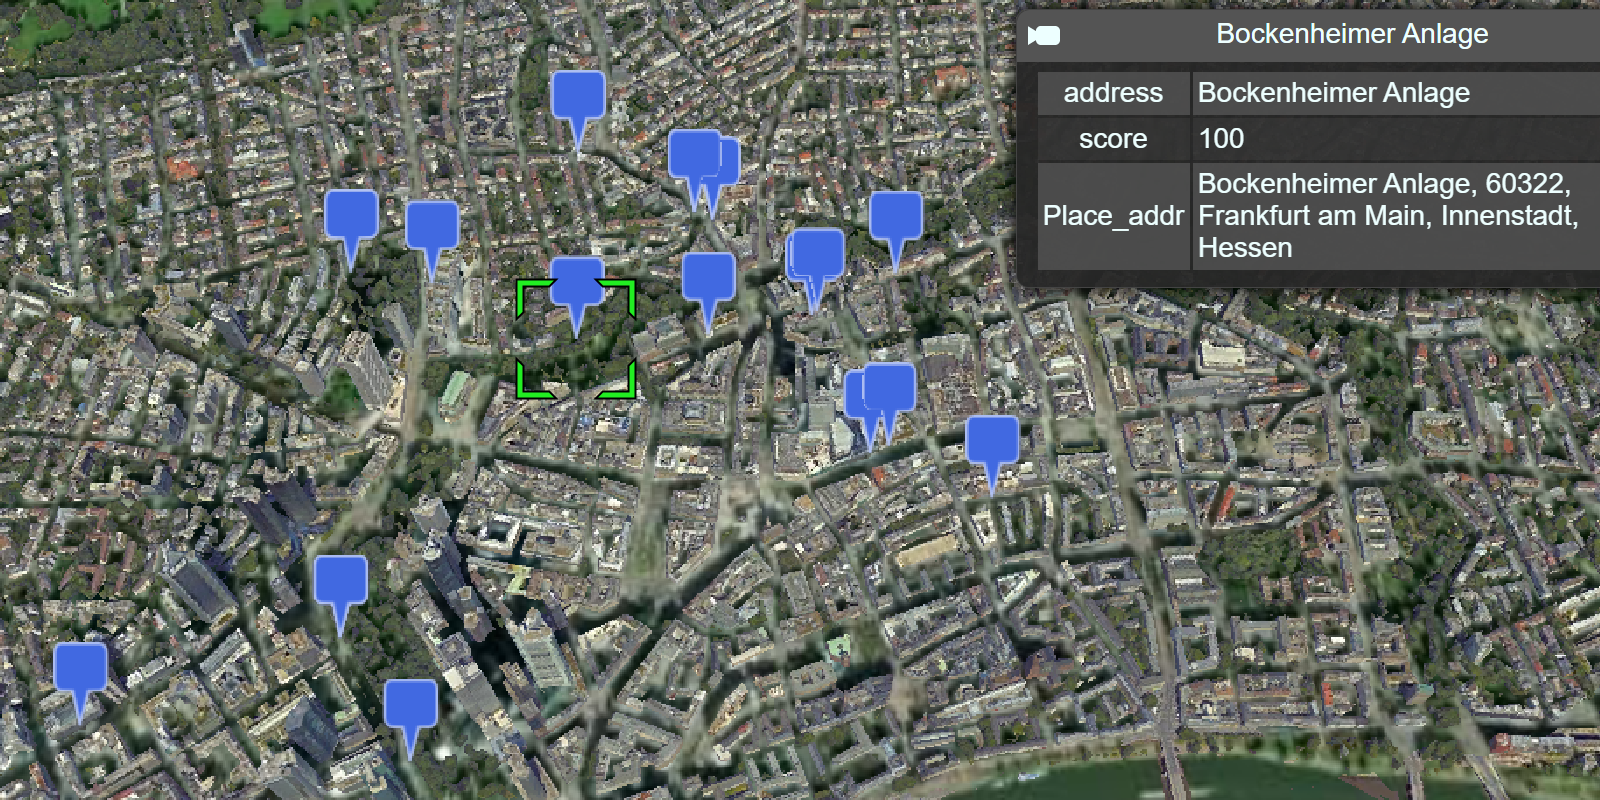
Find place addresses
Search for coffee shops, gas stations, restaurants and other nearby places with the Geocoding service.