You can style feature layers, which are composed of features, to help visualize the data in your application.
Feature styles
You can style points, lines, and polygons for visualization in a scene by defining symbols for features. To style features in a feature layer, you define symbols and apply them with a renderer. For data-driven visualization, the symbol is always determined based on a data (attribute) value returned from a field in the data layer.
To style a hosted feature layer in CesiumJS, add the feature layer to a scene as a Geo then style the contents of the layer's Entity. Each feature in the layer is represented as an Entity, which can display custom graphics. The attributes of each feature are stored in the entity's properties variable.
How to style a feature layer
-
Select an existing hosted feature layer, or create a new one in your portal by uploading a CSV, XLS, GeoJSON, or Shapefile.
-
In your CesiumJS application, add references to the ArcGIS REST JS
requestandfeature-servicepackages. -
Use
arcgisto query the URL of the feature service and return results as GeoJSON.Rest.query Features -
Add the REST JS response to your scene as a
Cesium.Geo. Pass properties in theJson Data Source Loadto perform basic styling and clamp data to terrain.Options -
After the layer is loaded, iterate through through each
Entitycreated by the layer and set theBillboard,Point,Polyline, orPolygonproperties. You can also represent data with a custom glTFModel.
Example
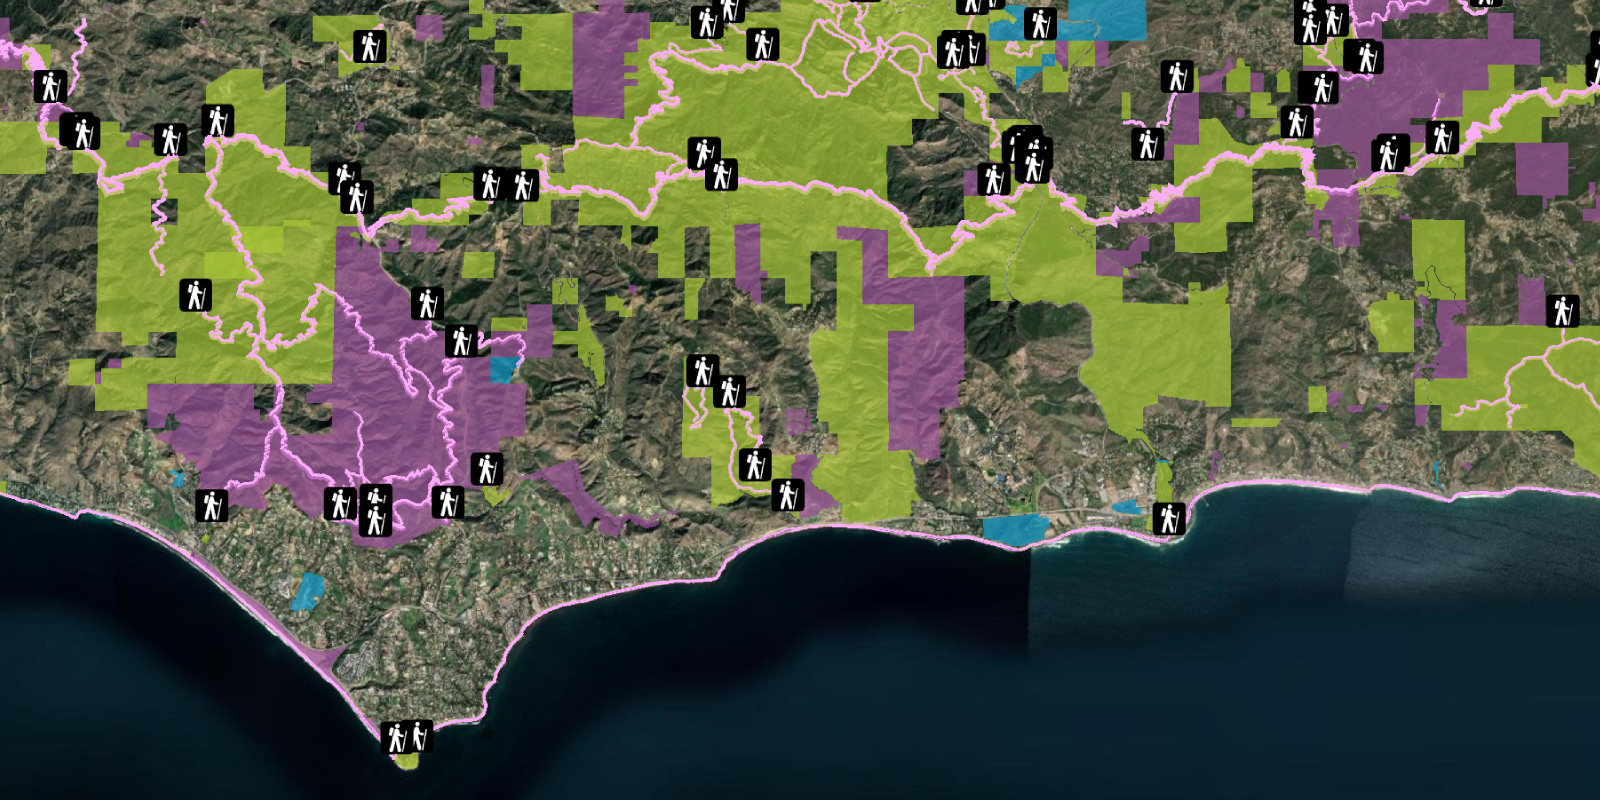
Style point data with custom icons
This example loads the Trailheads hosted feature layer using ArcGIS REST JS and sets the Billboard property of the results to display a custom hiker icon at each trailhead location.
const pointLayerURL = "https://services3.arcgis.com/GVgbJbqm8hXASVYi/arcgis/rest/services/Trailheads/FeatureServer/0";
arcgisRest.queryFeatures({
url: pointLayerURL,
authentication,
f:"geojson"
}).then((response) => {
Cesium.GeoJsonDataSource.load(response,{
clampToGround:true
}).then((dataSource) => {
dataSource.name="trailheads";
viewer.dataSources.add(dataSource);
const entities = dataSource.entities.values;
for (let i=0; i<entities.length;i++) {
entities[i].billboard.image = "http://static.arcgis.com/images/Symbols/NPS/npsPictograph_0231b.png"
entities[i].billboard.scale=0.4;
}
})
})