Learn how to calculate the area that can be reached in a given driving time from a location.
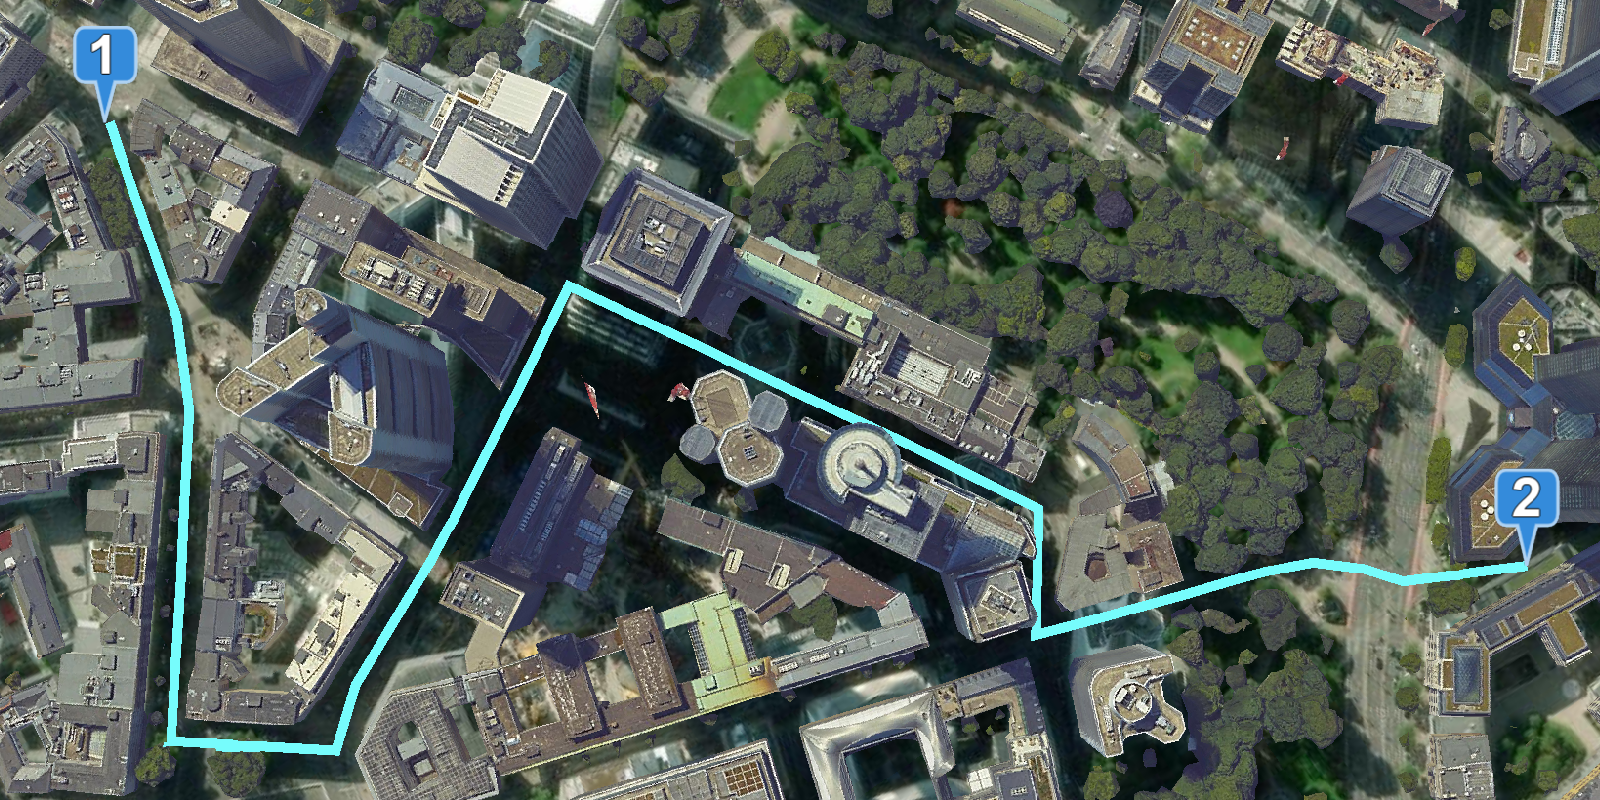
A service area, also known as an isochrone, is a polygon that represents the area that can be reached when driving or walking on a street network. The area that can be reached is restricted by either time or distance. To calculate service areas, you can use the routing service. You provide a start location (facilities), one or more time or distance values, and a spatial reference. Once processed, the service returns the service areas that can be reached.
In this tutorial, you create and display five, ten, and fifteen minute drive time service areas when the map is clicked. You use data-driven styling to give each polygon a different shade of blue.
Prerequisites
You need an ArcGIS Location Platform or ArcGIS Online account.
Steps
Create a new pen
- To get started, either complete the Display a scene tutorial or .
Get an access token
You need an access token with the correct privileges to access the resources used in this tutorial.
-
Go to the Create an API key tutorial and create an API key with the following privilege(s):
- Privileges
- Location services > Basemaps
- Location services > Routing
- Privileges
-
Copy the API key access token to your clipboard when prompted.
-
In CodePen, update the
accessvariable to use your access token.Token Use dark colors for code blocks const accessToken = "YOUR_ACCESS_TOKEN"; Cesium.ArcGisMapService.defaultAccessToken = accessToken; const cesiumAccessToken = "YOUR_CESIUM_ACCESS_TOKEN"; Cesium.Ion.defaultAccessToken = cesiumAccessToken; const arcGisImagery = Cesium.ArcGisMapServerImageryProvider.fromBasemapType(Cesium.ArcGisBaseMapType.SATELLITE); const viewer = new Cesium.Viewer("cesiumContainer", { baseLayer: Cesium.ImageryLayer.fromProviderAsync(arcGisImagery), });
To learn about the other types of authentication available, go to Types of authentication.
Add references to ArcGIS REST JS
-
In the
<head>element, reference theroutingandrequestpackages from ArcGIS REST JS.Use dark colors for code blocks <script src="https://cesium.com/downloads/cesiumjs/releases/1.114/Build/Cesium/Cesium.js"></script> <link href="https://cesium.com/downloads/cesiumjs/releases/1.114/Build/Cesium/Widgets/widgets.css" rel="stylesheet"> <script src="https://unpkg.com/@esri/arcgis-rest-request@4.0.0/dist/bundled/request.umd.js"></script> <script src="https://unpkg.com/@esri/arcgis-rest-routing@4.0.0/dist/bundled/routing.umd.js"></script>
Update the scene
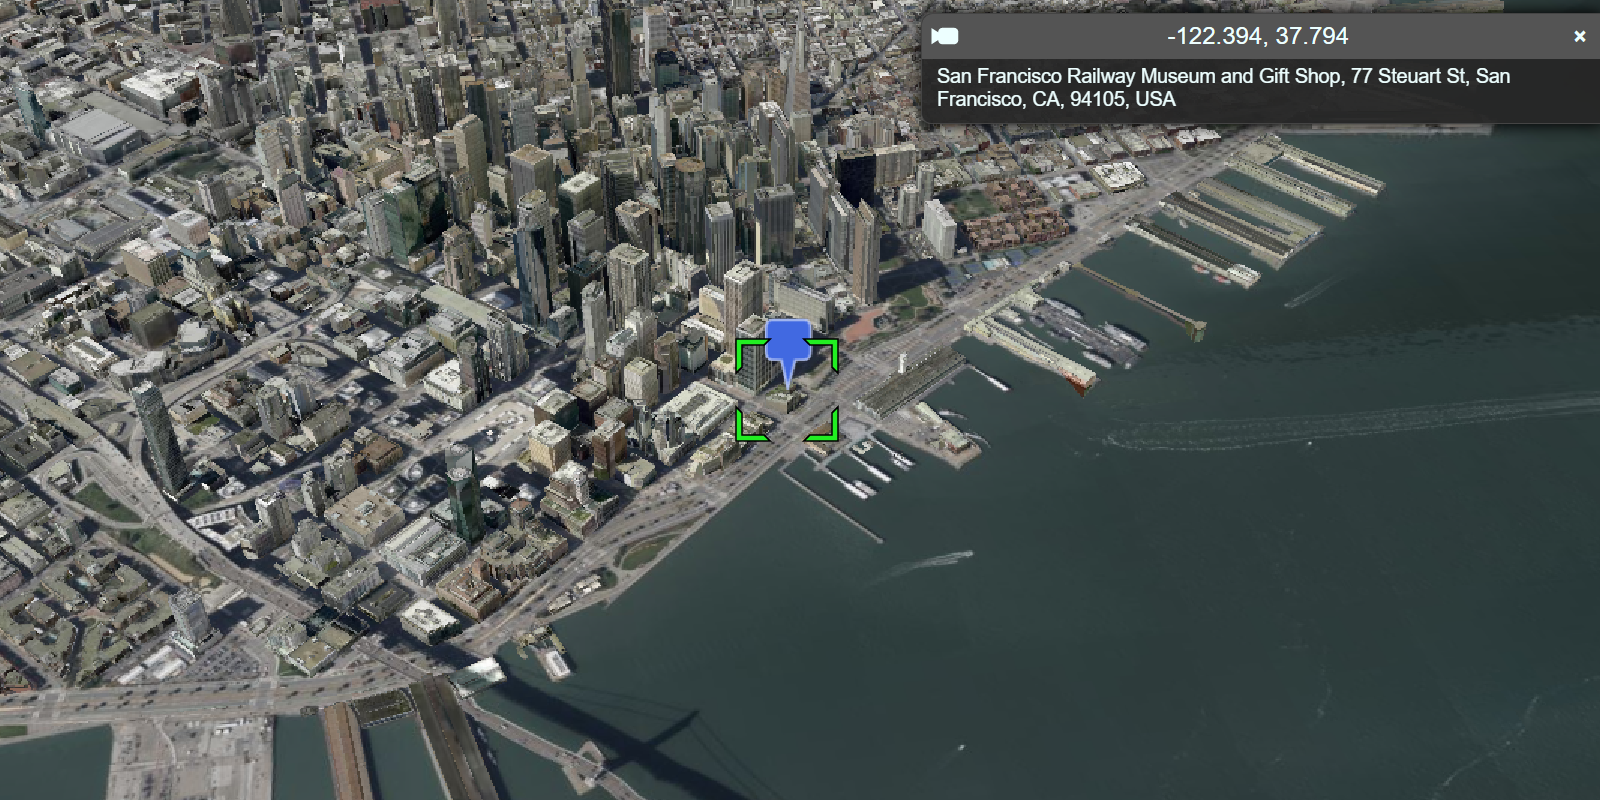
This routing application uses a 3D object layer San Francisco. Update the scene extent to focus on San Francisco, CA.
-
Update the
setcommand to center on locationView [-122.38329, 37.74015, 16000], San Francisco.Use dark colors for code blocks viewer.camera.setView({ destination : Cesium.Cartesian3.fromDegrees(8.68019, 50.1147 , 500), orientation : { heading: Cesium.Math.toRadians(-120), pitch : Cesium.Math.toRadians(-28.0), } }); -
Add the San Francisco Buildings 3D object layer to the scene as an
I3SData.Provider Use dark colors for code blocks viewer.camera.setView({ destination : Cesium.Cartesian3.fromDegrees(8.68019, 50.1147 , 500), orientation : { heading: Cesium.Math.toRadians(-120), pitch : Cesium.Math.toRadians(-28.0), } }); const geoidService = await Cesium.ArcGISTiledElevationTerrainProvider.fromUrl("https://tiles.arcgis.com/tiles/z2tnIkrLQ2BRzr6P/arcgis/rest/services/EGM2008/ImageServer"); const i3sProvider = await Cesium.I3SDataProvider.fromUrl("https://tiles.arcgis.com/tiles/cFEFS0EWrhfDeVw9/arcgis/rest/services/Buildings_Frankfurt_2021/SceneServer", { geoidTiledTerrainProvider: geoidService, token: accessToken }) viewer.scene.primitives.add(i3sProvider);
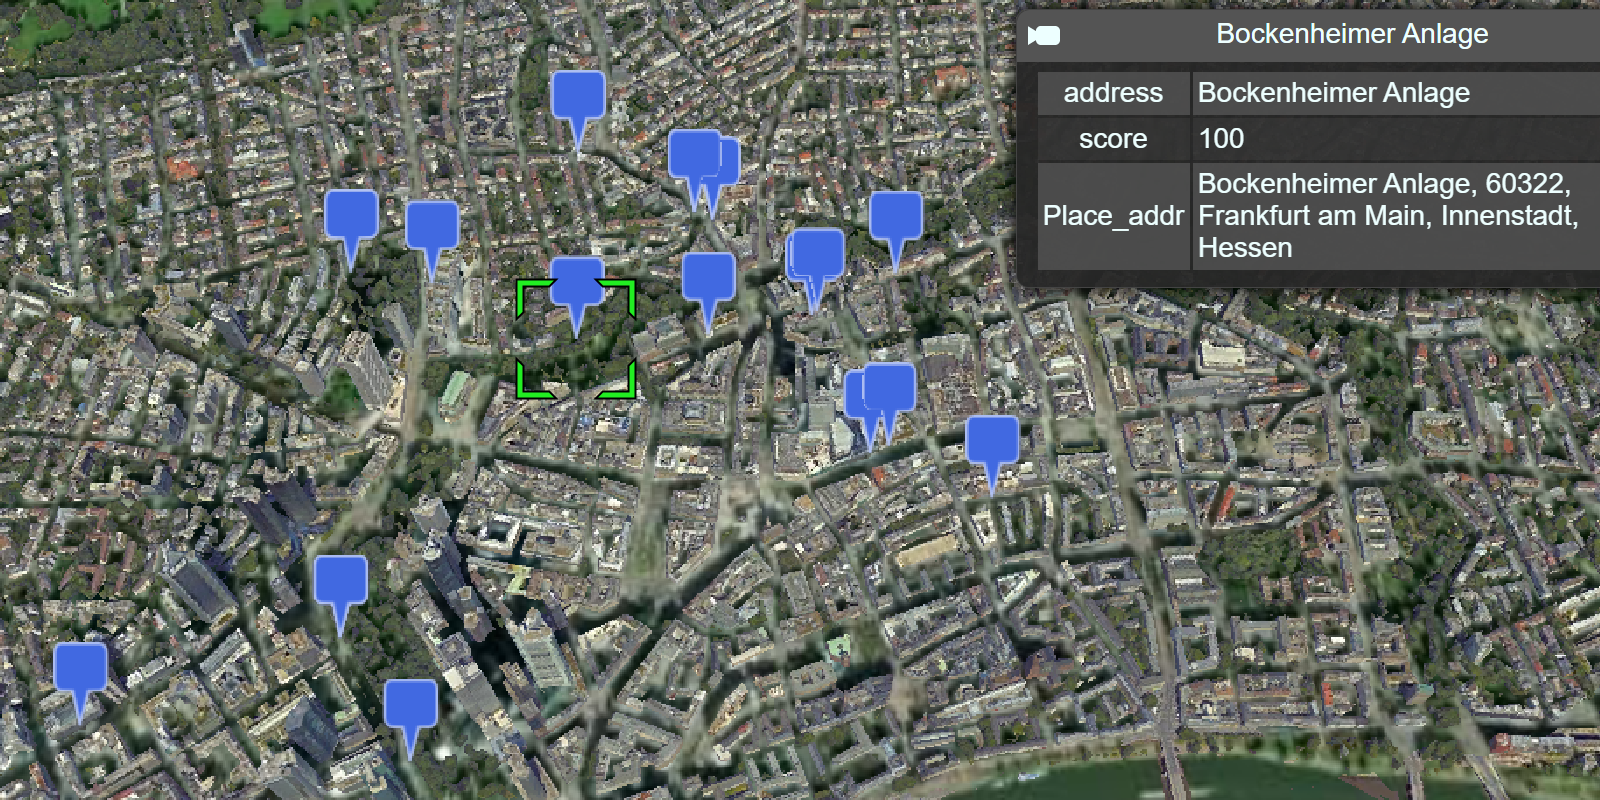
Create a starting location graphic
Create a Billboard entity to indicate the location from which a service area will be calculated. You can use Billboard entities to display custom pins and images.
-
Add a new
Billboardentity to the viewer to represent the origin location. Set thepositionof the entity tonull.Use dark colors for code blocks viewer.camera.setView({ destination : Cesium.Cartesian3.fromDegrees(-122.38329, 37.74015, 16000), orientation : { pitch : Cesium.Math.toRadians(-70.0), } }); const origin = viewer.entities.add({ name:'start', position:null, billboard: { verticalOrigin: Cesium.VerticalOrigin.BOTTOM, heightReference: Cesium.HeightReference.CLAMP_TO_GROUND, } }) -
Create a
Pinand use it to set theBuilder imageproperty of the billboard.Use dark colors for code blocks const pinBuilder = new Cesium.PinBuilder(); const origin = viewer.entities.add({ name:'start', position:null, billboard: { verticalOrigin: Cesium.VerticalOrigin.BOTTOM, heightReference: Cesium.HeightReference.CLAMP_TO_GROUND, image: pinBuilder.fromColor(Cesium.Color.fromCssColorString('#ffffff'),48).toDataURL(), } })
Add a click handler
Use an event handler to set the location of the origin and when a user clicks.
-
Create a
Screenfor theSpace Event Handler Viewerthat listens for left clicks. Create anofunction that runs when a click is detected.n Left Click Use dark colors for code blocks image: pinBuilder.fromColor(Cesium.Color.fromCssColorString('#ffffff'),48).toDataURL(), } }) viewer.screenSpaceEventHandler.setInputAction(movement => { },Cesium.ScreenSpaceEventType.LEFT_CLICK); -
Set the position of the
originentity to the coordinates of the clicked location. Callviewer.datato remove stale service area polygons.Sources.remove All() Use dark colors for code blocks viewer.screenSpaceEventHandler.setInputAction(movement => { const pickedPosition = viewer.scene.pickPosition(movement.position); origin.position = pickedPosition; viewer.dataSources.removeAll(); },Cesium.ScreenSpaceEventType.LEFT_CLICK);
Get service areas
To calculate a service area from a point, use the ArcGIS REST JS service function to make a request to the routing service.
-
Create a new
arcgisand set your access token.Rest.Api K e y Manager Use dark colors for code blocks const accessToken = "YOUR_ACCESS_TOKEN"; Cesium.ArcGisMapService.defaultAccessToken = accessToken; const authentication = arcgisRest.ApiKeyManager.fromKey(accessToken); -
Create a function called
getthat accepts a coordinate pair. Inside, callService Area arcgisand set theRest.service Area facilitiesparameter to the set of coordinates.arcgiscreates a direct request to theRest.service Area solveendpoint of the routing service. To learn more about theService Area solveendpoint, go to the Routing service page in the Mapping and location services guide.Service Area Use dark colors for code blocks viewer.screenSpaceEventHandler.setInputAction(movement => { const pickedPosition = viewer.scene.pickPosition(movement.position); origin.position = pickedPosition; viewer.dataSources.removeAll(); },Cesium.ScreenSpaceEventType.LEFT_CLICK); function getServiceArea(coordinates) { arcgisRest .serviceArea({ facilities: [coordinates], authentication }) } -
Access the service response and add the returned GeoJSON to your application as a
Geo.Json Data Source Use dark colors for code blocks function getServiceArea(coordinates) { arcgisRest .serviceArea({ facilities: [coordinates], authentication }) .then((response) => { const serviceJSON = response.saPolygons.geoJson; Cesium.GeoJsonDataSource.load(serviceJSON,{ clampToGround:true }) .then((dataSource)=>{ viewer.dataSources.add(dataSource); }); }) } -
Set the
materialof each service area polygon based on its drive time from the origin using theFromproperty.Break Use dark colors for code blocks .then((response) => { const serviceJSON = response.saPolygons.geoJson; Cesium.GeoJsonDataSource.load(serviceJSON,{ clampToGround:true }) .then((dataSource)=>{ viewer.dataSources.add(dataSource); const entities = dataSource.entities.values; for (let i=0; i<entities.length;i++) { const feature = entities[i]; feature.polygon.outline = false; if (feature.properties.FromBreak == 0) { feature.polygon.material = Cesium.Color.fromHsl(0.5833,.8,.4,.7); feature.polygon.extrudedHeight = 300; } else if (feature.properties.FromBreak == 5) { feature.polygon.material = Cesium.Color.fromHsl(0.5833,.8,.6,.7); feature.polygon.extrudedHeight = 200; } else { feature.polygon.material = Cesium.Color.fromHsl(0.5833,.8,.8,.7); feature.polygon.extrudedHeight = 100; } } }); }) -
In your
ofunction, convert the coordinates of the user's click fromn Left Click Cartesianto longitude and latitude degrees. Callgetwith the longitude and latitudeService Area Use dark colors for code blocks viewer.screenSpaceEventHandler.setInputAction(movement => { const pickedPosition = viewer.scene.pickPosition(movement.position); origin.position = pickedPosition; viewer.dataSources.removeAll(); const cartographic = Cesium.Cartographic.fromCartesian(pickedPosition); const originLatLng = [Cesium.Math.toDegrees(cartographic.longitude),Cesium.Math.toDegrees(cartographic.latitude)] getServiceArea(originLatLng); },Cesium.ScreenSpaceEventType.LEFT_CLICK);
Run the app
In CodePen, run your code to display the map.
When the application loads, you should be able to click on a locations to create an origin point. The routing service should then calculate drive time polygons representing the areas reachable within a 5, 10, and 15 minute drive.
What's next?
Learn how to use additional ArcGIS location services in these tutorials: