This sample demonstrates how to style Point graphics on GraphicsLayer with CIMSymbol.
The app uses SketchViewModel to allow users to add new Graphics. Users could choose to use number or letter to represent the new Graphics by choosing the corresponding tool from the top-right toolbar. The following snippet shows how graphics are added to the map.
function addGraphic(event) { if (event.state === "complete") { const cimSymbol = { type: "cim", // get JSON data defining CIMSymbolReference data: getCIMSymbolData(), }; graphicsLayer.remove(event.graphic); const newGraphic = new Graphic({ geometry: event.graphic.geometry, attributes: { // used to define the text string in the symbol text: pointType === "number" ? String(numberIndex++) : String.fromCharCode(64 + letterIndex++), }, symbol: cimSymbol, }); graphicsLayer.add(newGraphic); sketchViewModel.create("point"); } }The CIMSymbol uses a PrimitiveOverride to update the value of the textString property based on the text attribute of the graphic.
154 collapsed lines
<!doctype html><html lang="en"> <head> <meta charset="utf-8" /> <meta name="viewport" content="width=device-width, initial-scale=1, shrink-to-fit=no" /> <title>Intro to CIMSymbol | Sample | ArcGIS Maps SDK for JavaScript</title>
<!-- Load the ArcGIS Maps SDK for JavaScript from CDN --> <script type="module" src="https://js.arcgis.com/5.1/"></script>
<style> html, body { height: 100%; margin: 0; }
#sampleInstructions { padding: 10px; line-height: 1.3em; width: 300px; } </style> </head>
<body> <arcgis-map basemap="gray-vector" zoom="3" center="106.79, 38.23"> <arcgis-zoom slot="top-left"></arcgis-zoom> <calcite-action-pad slot="top-right" layout="horizontal"> <calcite-action id="pointButtonNumber" text="Draw point with number" icon="number" active></calcite-action> <calcite-action id="pointButtonLetter" text="Draw point with letter" icon="string"></calcite-action> <calcite-action id="resetBtn" text="Clear graphics" icon="trash"></calcite-action> <calcite-tooltip slot="expand-tooltip">Toggle Action Bar</calcite-tooltip> </calcite-action-pad> <arcgis-expand slot="top-left" expand-icon="question" expand-tooltip="How to use this sample" expanded> <div id="sampleInstructions"> Click on the map to start drawing. Use the top right toolbar to switch tools or reset. </div> </arcgis-expand> </arcgis-map>
<script type="module"> const [SketchViewModel, Graphic, GraphicsLayer] = await $arcgis.import([ "@arcgis/core/widgets/Sketch/SketchViewModel.js", "@arcgis/core/Graphic.js", "@arcgis/core/layers/GraphicsLayer.js", ]);
const viewElement = document.querySelector("arcgis-map"); await viewElement.viewOnReady();
let numberIndex = 1; let letterIndex = 1; let pointType = "number";
// Set up initial graphics const initialGraphicsCoordinates = [ [31.19, 122.12], [22.33, 113.94], [31.11, 114.56], ]; const initialGraphics = initialGraphicsCoordinates.map((coordinates) => { return new Graphic({ geometry: { type: "point", latitude: coordinates[0], longitude: coordinates[1], }, attributes: { text: pointType === "number" ? String(numberIndex++) : String.fromCharCode(64 + letterIndex++), }, symbol: { type: "cim", data: getCIMSymbolData(), }, }); });
// Create GraphicsLayer to hold graphics created via SketchViewModel const graphicsLayer = new GraphicsLayer({ graphics: initialGraphics, });
viewElement.map.add(graphicsLayer);
// Create a new SketchViewModel const sketchViewModel = new SketchViewModel({ view: viewElement.view, layer: graphicsLayer, });
// Listen to create event to add a newly created graphic to the map sketchViewModel.on("create", addGraphic);
function addGraphic(event) { if (event.state === "complete") { const cimSymbol = { type: "cim", // get JSON data defining CIMSymbolReference data: getCIMSymbolData(), }; graphicsLayer.remove(event.graphic); const newGraphic = new Graphic({ geometry: event.graphic.geometry, attributes: { // used to define the text string in the symbol text: pointType === "number" ? String(numberIndex++) : String.fromCharCode(64 + letterIndex++), }, symbol: cimSymbol, }); graphicsLayer.add(newGraphic); sketchViewModel.create("point"); } }
const drawPointButtonLetter = document.getElementById("pointButtonLetter"); drawPointButtonLetter.addEventListener("click", () => { // set the sketch to create a point geometry sketchViewModel.create("point"); setActiveButton(drawPointButtonLetter); pointType = "letter"; });
const drawPointButtonNumber = document.getElementById("pointButtonNumber"); sketchViewModel.create("point"); setActiveButton(drawPointButtonNumber); drawPointButtonNumber.addEventListener("click", () => { // set the sketch to create a point geometry sketchViewModel.create("point"); setActiveButton(drawPointButtonNumber); pointType = "number"; });
// clear the graphics from the map and reset indices document.getElementById("resetBtn").addEventListener("click", () => { graphicsLayer.removeAll(); numberIndex = 1; letterIndex = 1; });
function setActiveButton(selectedButton) { viewElement.focus(); const elements = document.getElementsByTagName("calcite-action"); for (let i = 0; i < elements.length; i++) { elements[i].active = false; } if (selectedButton) { selectedButton.active = true; } }
function getCIMSymbolData() { return {
type: "CIMSymbolReference", primitiveOverrides: [ { type: "CIMPrimitiveOverride", primitiveName: "textGraphic", propertyName: "TextString", valueExpressionInfo: { type: "CIMExpressionInfo", title: "Custom", expression: "$feature.text", returnType: "Default", }, }, ],188 collapsed lines
symbol: { type: "CIMPointSymbol", symbolLayers: [ { type: "CIMVectorMarker", enable: true, size: 32, colorLocked: true, anchorPointUnits: "Relative", frame: { xmin: -5, ymin: -5, xmax: 5, ymax: 5 }, markerGraphics: [ { type: "CIMMarkerGraphic", primitiveName: "textGraphic", geometry: { x: 0, y: 0 }, symbol: { type: "CIMTextSymbol", fontFamilyName: "Arial", fontStyleName: "Bold", height: 4, horizontalAlignment: "Center", offsetX: 0, offsetY: 5.5, symbol: { type: "CIMPolygonSymbol", symbolLayers: [ { type: "CIMSolidFill", enable: true, color: [255, 255, 255, 255], }, ], }, verticalAlignment: "Center", }, textString: "", }, ], scaleSymbolsProportionally: true, respectFrame: true, }, { type: "CIMVectorMarker", enable: true, anchorPoint: { x: 0, y: -0.5 }, anchorPointUnits: "Relative", size: 36.8, frame: { xmin: 0.0, ymin: 0.0, xmax: 17.0, ymax: 17.0 }, markerGraphics: [ { type: "CIMMarkerGraphic", geometry: { rings: [ [ [8.5, 0.2], [7.06, 0.33], [5.66, 0.7], [4.35, 1.31], [3.16, 2.14], [2.14, 3.16], [1.31, 4.35], [0.7, 5.66], [0.33, 7.06], [0.2, 8.5], [0.33, 9.94], [0.7, 11.34], [1.31, 12.65], [2.14, 13.84], [3.16, 14.86], [4.35, 15.69], [5.66, 16.3], [7.06, 16.67], [8.5, 16.8], [9.94, 16.67], [11.34, 16.3], [12.65, 15.69], [13.84, 14.86], [14.86, 13.84], [15.69, 12.65], [16.3, 11.34], [16.67, 9.94], [16.8, 8.5], [16.67, 7.06], [16.3, 5.66], [15.69, 4.35], [14.86, 3.16], [13.84, 2.14], [12.65, 1.31], [11.34, 0.7], [9.94, 0.33], [8.5, 0.2], ], ], }, symbol: { type: "CIMPolygonSymbol", symbolLayers: [ { type: "CIMSolidFill", enable: true, color: [39, 129, 153, 255], }, ], }, }, ], scaleSymbolsProportionally: true, respectFrame: true, }, { type: "CIMVectorMarker", enable: true, anchorPoint: { x: 0, y: 0 }, anchorPointUnits: "Relative", size: 4, frame: { xmin: 0.0, ymin: 0.0, xmax: 39.7, ymax: 17.0, }, markerGraphics: [ { type: "CIMMarkerGraphic", geometry: { rings: [ [ [32.2, 0.0], [7.4, 0.0], [6.0, 0.2], [4.6, 0.6], [3.3, 1.4], [2.2, 2.5], [1.2, 3.8], [0.6, 5.2], [0.1, 6.8], [0.0, 8.5], [0.1, 10.2], [0.6, 11.8], [1.2, 13.2], [2.2, 14.5], [3.3, 15.6], [4.6, 16.4], [6.0, 16.8], [7.4, 17.0], [32.2, 17.0], [33.7, 16.8], [35.1, 16.4], [36.4, 15.6], [37.5, 14.5], [38.4, 13.2], [39.1, 11.7], [39.6, 10.2], [39.7, 8.5], [39.6, 6.8], [39.1, 5.3], [38.4, 3.8], [37.5, 2.5], [36.4, 1.4], [35.1, 0.6], [33.7, 0.2], [32.2, 0.0], ], ], }, symbol: { type: "CIMPolygonSymbol", symbolLayers: [ { type: "CIMSolidFill", enable: true, color: [170, 170, 170, 255], }, ], }, }, ], scaleSymbolsProportionally: true, respectFrame: true, }, ], }, }; } </script> </body></html>Related samples and resources
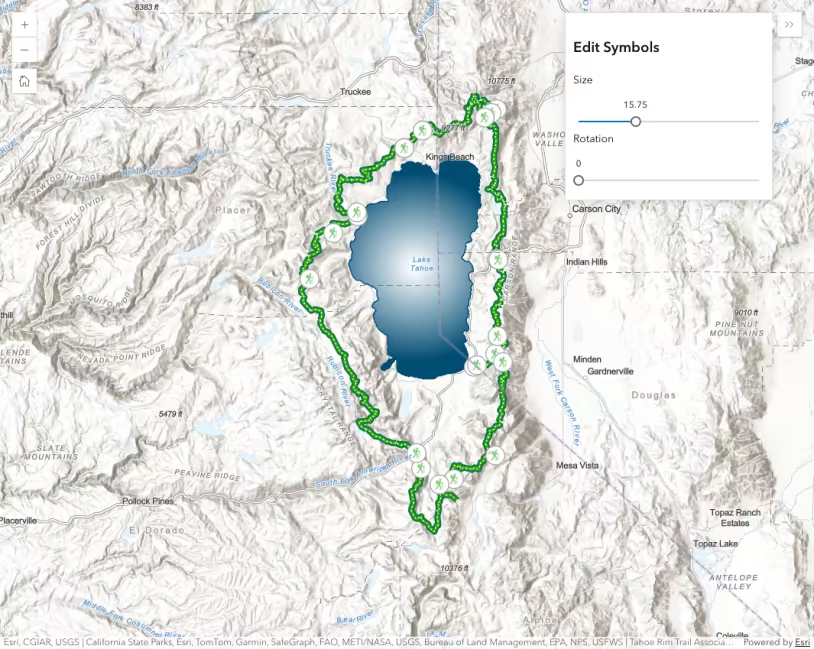
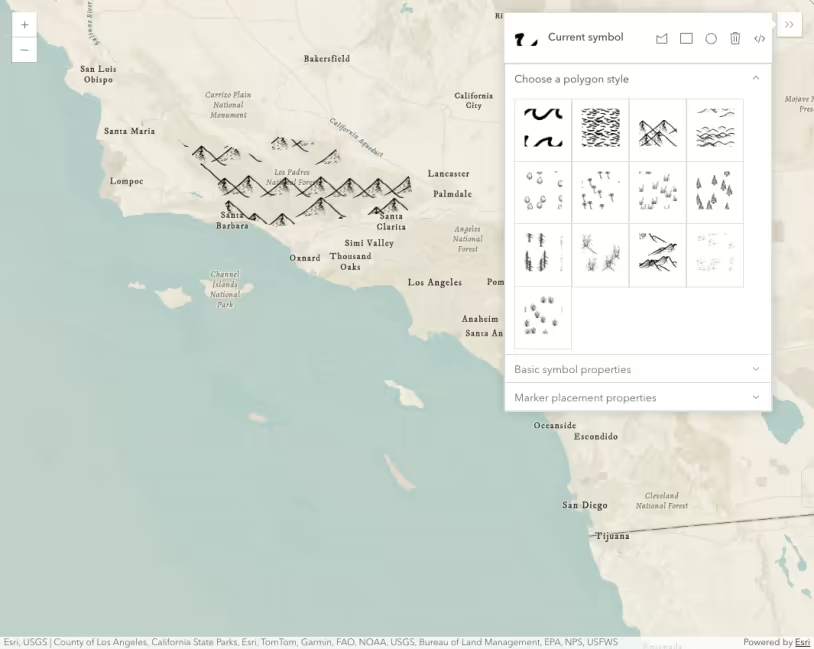
CIMSymbol lines and polygons
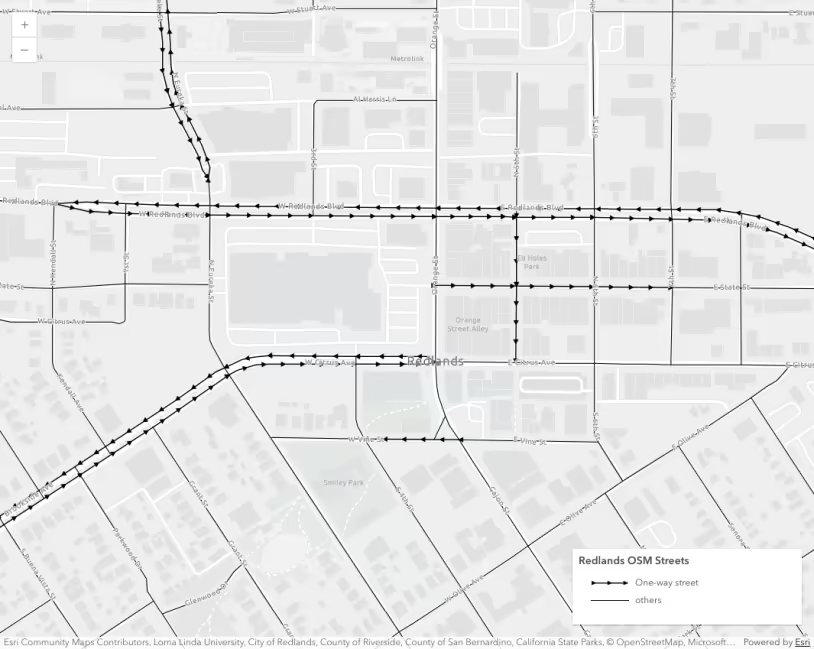
Arrows along a line