This sample demonstrates how to generate a renderer that changes icon sizes in a point layer by map scale. The same workflow will also work for polyline layers, and is only supported for visualizations in 2D.
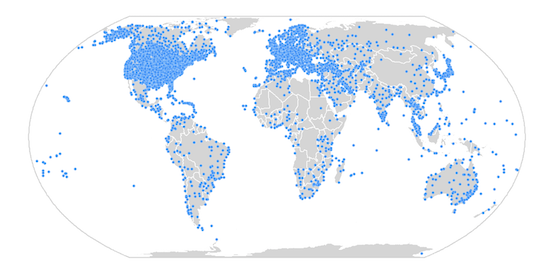
When setting a static size of 10px to a marker symbol in a SimpleRenderer on a point layer, the visualization will look good at larger (regional) scales, but will look too cluttered at small scales.
const renderer = new SimpleRenderer({ symbol: { type: "simple-marker", // autocasts as new SimpleMarkerSymbol() color: "dodgerblue", outline: { color: [255, 255, 255, 0.7], width: 0.5, }, size: 7.5, // 7.5 points is 10px }, });| 10px icons clutter the view at a global extent | …but look good at regional extents |
|---|---|
 |  |
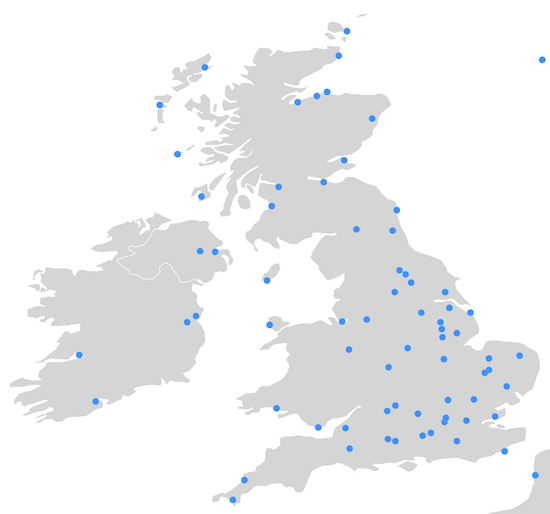
On the other hand when setting a smaller icon size of 2px to a marker symbol in a simple renderer the visualization will look good at smaller scales, but may be too difficult to see at larger (regional) scales.
const renderer = new SimpleRenderer({ symbol: { type: "simple-marker", color: "dodgerblue", outline: { color: [255, 255, 255, 0.7], width: 0.5, }, size: 1.5, // 1.5 points is 2 pixels },});| 2px icons look good at a global extent | …but can be too difficult to see at regional extents |
|---|---|
 |  |
The location.createRenderer() method (and other Smart Mapping renderer creator methods) has a sizeOptimizationEnabled parameter that when set to true generates a Size Variable that maps icon sizes to view scales.
// generates a new renderer with a scale-dependent // size visual variable to vary icon size by scale locationRendererCreator .createRenderer({ layer: layer, view: viewElement.view, sizeOptimizationEnabled: sizeOptimizationEnabled, }) .then((rendererResponse) => { // the renderer contains a size variable with stops // mapping icon sizes to scale values const renderer = rendererResponse.renderer; renderer.symbol.color = "dodgerblue"; layer.renderer = renderer; }) .catch((error) => { console.error(error); });This variable is part of the output renderer, which when set on the input layer, gives a much better visual that works well across various scales.
| Sizes are smaller at global extents | …and larger at regional extents |
|---|---|
 |  |
Once the variable is generated for the layer, you can clone it and use it in any other renderer set to that layer. This avoids unnecessary calls to Smart Mapping methods.
// icon sizes will linearly change// depending on the map scale// This variable was generated using the previous snippetconst sizeVariable = {  type: "sizeInfo",  valueExpression: "$view.scale",  stops: [    {      size: 7.5,      value: 1155581.108577,    },    {      size: 6,      value: 9244648.868618,    },    {      size: 3,      value: 73957190.948944,    },    {      size: 1.5,      value: 591657527.591555,    },  ],};
const renderer = layer.renderer.clone();renderer.visualVariables.push(sizeVariable);layer.renderer = renderer;
A word of caution
Keep in mind that generating renderers should be avoided in most applications because of the performance cost affecting the end user. As stated in the Smart Mapping guide topic, the Smart Mapping APIs were designed for two types of applications: data exploration apps and visualization authoring apps similar to ArcGIS Online. In all other cases, renderers should be saved to the layer or manually created using any of the renderer classes.