What is terrain rendering?
Terrain rendering is the process of displaying elevation in a 3D scene. The starting point for rendering terrain in a scene is a digital elevation model. Publish this dataset as an elevation service and then load it in your application as an elevation layer. If you don’t have your own elevation model, you can use Esri’s World Elevation Service.
The elevation layer is not visible in a 3D scene, but you can render a basemap layer draped on top of the elevation layer. Data layers can be draped on the elevation layer and placed at an absolute height or a relative one. When a 3D scene doesn’t have an elevation layer, the terrain is rendered as a plane displayed at zero height (sea level).
How to render terrain and align data layers to terrain
You can render terrain by adding an elevation layer and a basemap layer to your scene.
39 collapsed lines
<!doctype html><html> <head> <meta charset="utf-8" /> <title>Terrain rendering</title> <link rel="stylesheet" href="https://js.arcgis.com/5.0/esri/themes/light/main.css" /> <!-- Load the ArcGIS Maps SDK for JavaScript from CDN --> <script type="module" src="https://js.arcgis.com/5.0/"></script>
<style> html, body, #viewDiv { height: 100%; margin: 0; } </style>
<script type="module"> const [Map, FeatureLayer, SceneView, ElevationLayer, LabelClass, Basemap, TileLayer] = await $arcgis.import([ "@arcgis/core/Map.js", "@arcgis/core/layers/FeatureLayer.js", "@arcgis/core/views/SceneView.js", "@arcgis/core/layers/ElevationLayer.js", "@arcgis/core/layers/support/LabelClass.js", "@arcgis/core/Basemap.js", "@arcgis/core/layers/TileLayer.js", ]);
const basemap = new Basemap({ baseLayers: [ new TileLayer({ url: "https://wtb.maptiles.arcgis.com/arcgis/rest/services/World_Topo_Base/MapServer", }), ], });
const map = new Map({ ground: { layers: [ new ElevationLayer({ url: "https://elevation3d.arcgis.com/arcgis/rest/services/WorldElevation3D/Terrain3D/ImageServer", }), ], }, basemap: basemap, });99 collapsed lines
const view = new SceneView({ container: "viewDiv", map: map, camera: { position: [-118.80714018, 33.96144206, 1574.65501], heading: 0.51, tilt: 78.99, }, });
const trails = new FeatureLayer({ url: "https://services3.arcgis.com/GVgbJbqm8hXASVYi/arcgis/rest/services/Trails/FeatureServer/0", elevationInfo: { mode: "relative-to-ground", offset: 3, },
renderer: { type: "simple", symbol: { type: "line-3d", symbolLayers: [ { type: "line", material: { color: "#FF5500" }, size: "2px", }, ], }, }, });
const trailHeads = new FeatureLayer({ url: "https://services3.arcgis.com/GVgbJbqm8hXASVYi/arcgis/rest/services/Trailheads/FeatureServer/0", elevationInfo: { mode: "relative-to-ground", }, renderer: { type: "simple", symbol: { type: "point-3d", symbolLayers: [ { type: "icon", resource: { primitive: "circle" }, material: { color: "#FF5500" }, outline: { color: "#FFFFFF", size: 1 }, size: "10px", }, ], verticalOffset: { screenLength: 20, maxWorldLength: 200, minWorldLength: 20, }, callout: { type: "line", size: 1, color: "#FFFFFF", }, }, }, labelingInfo: [ new LabelClass({ labelExpressionInfo: { expression: "$feature.TRL_NAME" }, symbol: { type: "label-3d", symbolLayers: [ { type: "text", material: { color: "#FFFFFF", }, halo: { size: 1, color: [0, 0, 0, 0.5], }, font: { size: 11, family: "sans-serif", }, }, ], }, }), ], });
map.addMany([trails, trailHeads]); </script> </head>
<body> <div id="viewDiv"></div> </body></html>In most applications, there are additional data layers to add to your scene. The following image shows several options for vertically aligning data layers:
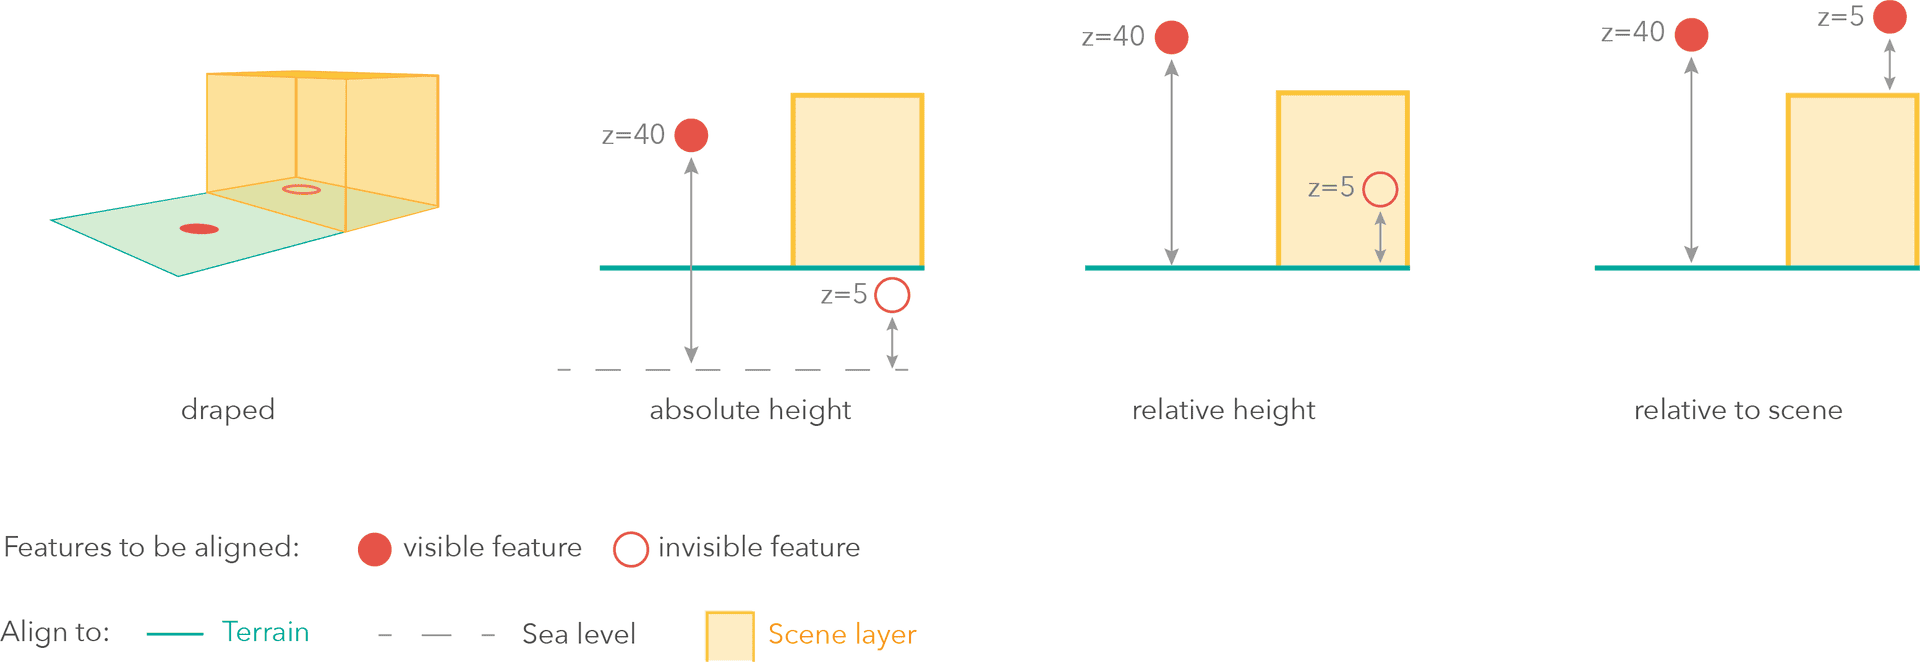
The hiking trails in the above example are rendered relative to the terrain with an offset of 3 meters:
62 collapsed lines
<!doctype html><html> <head> <meta charset="utf-8" /> <title>Terrain rendering</title> <link rel="stylesheet" href="https://js.arcgis.com/5.0/esri/themes/light/main.css" /> <!-- Load the ArcGIS Maps SDK for JavaScript from CDN --> <script type="module" src="https://js.arcgis.com/5.0/"></script>
<style> html, body, #viewDiv { height: 100%; margin: 0; } </style>
<script type="module"> const [Map, FeatureLayer, SceneView, ElevationLayer, LabelClass, Basemap, TileLayer] = await $arcgis.import([ "@arcgis/core/Map.js", "@arcgis/core/layers/FeatureLayer.js", "@arcgis/core/views/SceneView.js", "@arcgis/core/layers/ElevationLayer.js", "@arcgis/core/layers/support/LabelClass.js", "@arcgis/core/Basemap.js", "@arcgis/core/layers/TileLayer.js", ]);
const basemap = new Basemap({ baseLayers: [ new TileLayer({ url: "https://wtb.maptiles.arcgis.com/arcgis/rest/services/World_Topo_Base/MapServer", }), ], });
const map = new Map({ ground: { layers: [ new ElevationLayer({ url: "https://elevation3d.arcgis.com/arcgis/rest/services/WorldElevation3D/Terrain3D/ImageServer", }), ], }, basemap: basemap, });
const view = new SceneView({ container: "viewDiv", map: map, camera: { position: [-118.80714018, 33.96144206, 1574.65501], heading: 0.51, tilt: 78.99, }, });
const trails = new FeatureLayer({ url: "https://services3.arcgis.com/GVgbJbqm8hXASVYi/arcgis/rest/services/Trails/FeatureServer/0", elevationInfo: { mode: "relative-to-ground", offset: 3, },80 collapsed lines
renderer: { type: "simple", symbol: { type: "line-3d", symbolLayers: [ { type: "line", material: { color: "#FF5500" }, size: "2px", }, ], }, }, });
const trailHeads = new FeatureLayer({ url: "https://services3.arcgis.com/GVgbJbqm8hXASVYi/arcgis/rest/services/Trailheads/FeatureServer/0", elevationInfo: { mode: "relative-to-ground", }, renderer: { type: "simple", symbol: { type: "point-3d", symbolLayers: [ { type: "icon", resource: { primitive: "circle" }, material: { color: "#FF5500" }, outline: { color: "#FFFFFF", size: 1 }, size: "10px", }, ], verticalOffset: { screenLength: 20, maxWorldLength: 200, minWorldLength: 20, }, callout: { type: "line", size: 1, color: "#FFFFFF", }, }, }, labelingInfo: [ new LabelClass({ labelExpressionInfo: { expression: "$feature.TRL_NAME" }, symbol: { type: "label-3d", symbolLayers: [ { type: "text", material: { color: "#FFFFFF", }, halo: { size: 1, color: [0, 0, 0, 0.5], }, font: { size: 11, family: "sans-serif", }, }, ], }, }), ], });
map.addMany([trails, trailHeads]); </script> </head>
<body> <div id="viewDiv"></div> </body></html>Examples
Display a scene with elevation
You can display a simple scene using an
Steps
- Create a scene and add an
elevation layer and abasemap layer . - Set the scene to scene view.
- Set the camera position.
25 collapsed lines
<!doctype html><html> <head> <meta charset="utf-8" /> <title>Terrain rendering</title> <link rel="stylesheet" href="https://js.arcgis.com/5.0/esri/themes/light/main.css" /> <!-- Load the ArcGIS Maps SDK for JavaScript from CDN --> <script type="module" src="https://js.arcgis.com/5.0/"></script>
<style> html, body, #viewDiv { height: 100%; margin: 0; } </style>
<script type="module"> const [Map, SceneView] = await $arcgis.import([ "@arcgis/core/Map.js", "@arcgis/core/views/SceneView.js", ]);
const map = new Map({ ground: "world-elevation", basemap: "topo-vector", });
const view = new SceneView({ container: "viewDiv", map: map, camera: { position: [-118.80714018, 33.96144206, 1574.65501], heading: 0.51, tilt: 78.99, }, });8 collapsed lines
</script> </head>
<body> <div id="viewDiv"></div> </body></html>Display terrain with exaggeration
To emphasize the terrain, you might sometimes find it useful to display the terrain with exaggerated elevation values. In this example, you will show the highest mountain ranges and the lowest ocean regions on the globe. Because the Earth’s radius is so big, mountain range elevation isn’t visually noticeable. Here you will exaggerate 70 times these elevation values using Esri’s TopoBathy elevation service as the data source.
61 collapsed lines
<!doctype html><html> <head> <meta charset="utf-8" /> <title>Terrain exaggeration</title> <link rel="stylesheet" href="https://js.arcgis.com/5.0/esri/themes/light/main.css" /> <!-- Load the ArcGIS Maps SDK for JavaScript from CDN --> <script type="module" src="https://js.arcgis.com/5.0/"></script>
<style> html, body, #viewDiv { height: 100%; margin: 0; }
body { background: radial-gradient(#12bff2, #0269a1); }
#viewDiv canvas { filter: saturate(1.2) drop-shadow(0 0 20px white); }
.buttons { position: absolute; bottom: 20px; left: 0; right: 0; text-align: center; }
.esri-button { display: inline; max-width: 200px; } </style>
<script type="module"> const [Map, SceneView, ElevationLayer, BaseElevationLayer, Basemap, TileLayer] = await $arcgis.import([ "@arcgis/core/Map.js", "@arcgis/core/views/SceneView.js", "@arcgis/core/layers/ElevationLayer.js", "@arcgis/core/layers/BaseElevationLayer.js", "@arcgis/core/Basemap.js", "@arcgis/core/layers/TileLayer.js", ]);
const basemap = new Basemap({ baseLayers: [ new TileLayer({ url: "https://tiles.arcgis.com/tiles/nGt4QxSblgDfeJn9/arcgis/rest/services/terrain_with_heavy_bathymetry/MapServer", copyright: 'Bathymetry, topography and satellite imagery from <a href="https://visibleearth.nasa.gov/view_cat.php?categoryID=1484" target="_blank">NASA Visible Earth</a> | <a href="http://www.aag.org/global_ecosystems" target="_blank">World Ecological Land Units, AAG</a> | Oceans, glaciers and water bodies from <a href="https://www.naturalearthdata.com/" target="_blank">Natural Earth</a>', }), ], });
const ExaggeratedElevationLayer = BaseElevationLayer.createSubclass({ properties: { exaggeration: null, },
// The load() method is called when the layer is added to the map // prior to it being rendered in the view. load: function () { this._elevation = new ElevationLayer({ url: "https://elevation3d.arcgis.com/arcgis/rest/services/WorldElevation3D/TopoBathy3D/ImageServer", });
// wait for the elevation layer to load before resolving load() this.addResolvingPromise(this._elevation.load()); },
// Fetches the tile(s) visible in the view fetchTile: function (level, row, col, options) { // calls fetchTile() on the elevationlayer for the tiles // visible in the view return this._elevation.fetchTile(level, row, col, options).then( function (data) { var exaggeration = this.exaggeration; // `data` is an object that contains the // the width and the height of the tile in pixels, // and the values of each pixel for (var i = 0; i < data.values.length; i++) { // Multiply the given pixel value // by the exaggeration value data.values[i] = data.values[i] * exaggeration; }
return data; }.bind(this), ); }, });
const elevationLayer = new ExaggeratedElevationLayer({ exaggeration: 70 });
const map = new Map({ basemap: basemap, ground: { layers: [elevationLayer], }, });66 collapsed lines
const view = new SceneView({ container: "viewDiv", map: map, alphaCompositingEnabled: true, camera: { position: [-55.03975781, 14.94826384, 19921223.30821], heading: 2.03, tilt: 0.13, }, environment: { background: { type: "color", color: [255, 252, 244, 0], }, starsEnabled: false, atmosphereEnabled: false, lighting: { directShadowsEnabled: false, date: "Sun Jun 23 2019 19:19:18 GMT+0200 (Central European Summer Time)", }, }, constraints: { altitude: { min: 10000000, max: 25000000, }, }, popup: { dockEnabled: true, dockOptions: { position: "top-right", breakpoint: false, buttonEnabled: false, }, visibleElements: { collapseButton: false, }, } });
let exaggerated = true;
document.getElementById("exaggerate").addEventListener("click", function () { if (exaggerated) { map.ground = "world-elevation"; this.innerHTML = "Enable exaggeration"; exaggerated = false; } else { map.ground = { layers: [elevationLayer], }; this.innerHTML = "Disable exaggeration"; exaggerated = true; } }); </script> </head> <body> <div id="viewDiv"></div> <div class="buttons"> <button id="exaggerate" class="esri-button">Disable exaggeration</button> </div> </body></html>