Scene with a water body feature layer with water reflection and a scene layer with data from a scene service
What are cities in 3D?
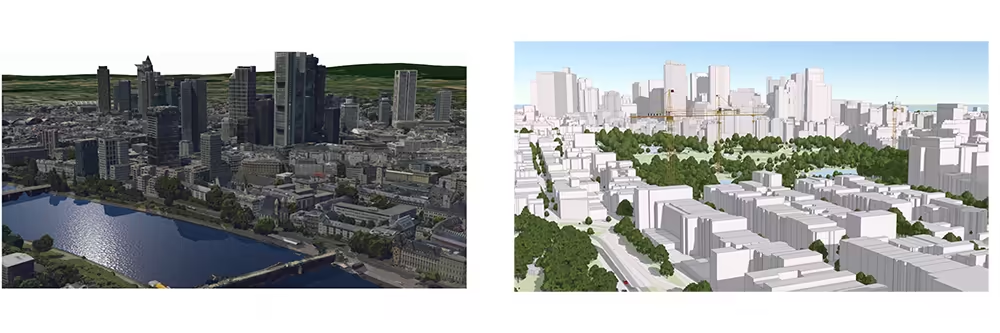
3D city visualizations are realistic or abstract depictions of city infrastructure. Among many others, such visualizations can show buildings, transportation infrastructure, tourist points of interest, or planned projects within a city.
You can create a 3D city visualization with styles that range from realistic to abstract. A realistic visualization renders the city in a way that mimics reality; a more abstract style renders buildings, vegetation, and other city elements using schematic objects. You can also create a visualization that blends these.
How to visualize cities in 3D
Buildings are an important part of most 3D city visualizations. The simplest way to visualize a building is to display its footprint on the terrain. The footprint is stored as a polygon feature layer and displayed with a fill symbol. This type of visualization is useful when buildings are not the center point of the visualization, but you want to include them for context.
A building’s footprint contains information about its height. You can use that height data to extrude its polygon. This is useful to show the height of buildings in a city, even when the detailed shape of the building is unimportant for your visualization.
For more information, see the Visualize buildings as footprints example.
Some visualizations can be made more compelling when they display the detailed 3D model of a building. 3D object scene layers store large city models that can be displayed with textures or colors. Such data can be modeled in software such as ArcGIS Pro or CityEngine, can be extracted from LiDAR data, and some 3D data has been made available on open data portals. A first step to visualize this type of data is to publish a scene service, add it to a map as a scene layer
For more information, see the Visualize buildings as 3D objects example.
To visualize a city in 3D realistically, you need 3D data. The most common types of data layers are integrated mesh layer and 3D object scene layer with textures.
3D mesh data capturing is an automated process that constructs 3D objects from large sets of overlapping imagery. This process is achieved using a drone, and the result is a textured mesh that includes all of the 3D objects in a city, such as buildings, trees, roads, and elevation information. Generally, there are no styling options are available for an integrated mesh layer, but data can be added to a scene to mark items, such as points of interest, neighborhoods, or landmarks within a city.
For more information, see the Realistic city visualization example.
Examples
Visualize buildings as footprints
You do not always need to use 3D data to visualize buildings in a 3D scene. The following example displays building footprints as both polygon fill symbols and as extruded polygon symbols. Data provided by the Open Data Portal of San Francisco. To create this visualization:
- Download data and publish as a feature layer on ArcGIS Online.
- Create a feature layer and set a renderer with a fill symbol or an extruded polygon symbol.
- Add the layer to a map and set the map on scene view.
42 collapsed lines
<!doctype html><html> <head> <meta charset="utf-8" /> <title>Cities in 3D</title> <link rel="stylesheet" href="https://js.arcgis.com/5.1/esri/themes/light/main.css" /> <!-- Load the ArcGIS Maps SDK for JavaScript from CDN --> <script type="module" src="https://js.arcgis.com/5.1/"></script>
<style> html, body, #viewDiv { height: 100%; margin: 0; }
.buttons { position: absolute; bottom: 20px; left: 0; right: 0; text-align: center; }
.esri-button { display: inline; background-color: white; min-width: 200px; max-width: 300px; } </style>
<script type="module"> const [Map, SceneView, SceneLayer, FeatureLayer] = await $arcgis.import([ "@arcgis/core/Map.js", "@arcgis/core/views/SceneView.js", "@arcgis/core/layers/SceneLayer.js", "@arcgis/core/layers/FeatureLayer.js", ]);
const footprintBuildings = new FeatureLayer({ url: "https://services2.arcgis.com/cFEFS0EWrhfDeVw9/arcgis/rest/services/san_francisco_footprints_selection/FeatureServer", renderer: { type: "simple", symbol: { type: "polygon-3d", symbolLayers: [ { type: "fill", material: { color: [255, 237, 204] }, outline: { color: [133, 108, 62, 0.5] }, }, ], }, }, visible: false, });
const extrudedBuildings = new FeatureLayer({ url: "https://services2.arcgis.com/cFEFS0EWrhfDeVw9/arcgis/rest/services/san_francisco_footprints_selection/FeatureServer", renderer: { type: "simple", symbol: { type: "polygon-3d", symbolLayers: [ { type: "extrude", material: { color: [255, 237, 204] }, edges: { type: "solid", color: [133, 108, 62, 0.5], size: 1, }, }, ], }, visualVariables: [ { type: "size", field: "heightcm", valueUnit: "centimeters", }, ],42 collapsed lines
}, visible: true, });
// Create Map var map = new Map({ basemap: "gray-vector", ground: "world-elevation", layers: [footprintBuildings, extrudedBuildings], });
// Create the SceneView var view = new SceneView({ container: "viewDiv", map: map, camera: { position: [-122.39899666, 37.77940678, 314.88439], heading: 356.82, tilt: 78.61, }, }); let type = "cartographic"; document.getElementById("footprint").addEventListener("click", function (event) { footprintBuildings.visible = true; extrudedBuildings.visible = false; }); document.getElementById("extruded").addEventListener("click", function (event) { footprintBuildings.visible = false; extrudedBuildings.visible = true; }); </script> </head>
<body> <div id="viewDiv"></div> <div class="buttons"> <button id="footprint" class="esri-button esri-button--secondary esri-button--half">Footprints</button> <button id="extruded" class="esri-button esri-button--secondary esri-button--half">Extruded footprints</button> </div> </body></html>Visualize buildings as 3D objects
3D geometry is required to visualize buildings as their actual 3D shape. The best way to store such data is through a 3D object scene layer. In this layer, each building represents a feature that stores information about its geometry, textures, and, optionally, some attribute details such as construction year or building’s usage.
In the following example, the buildings of San Francisco are added as a 3D object scene layer to the map. This layer contains the geometry and textures of each building.
To display the buildings using their original texture, you need to add them to the map without a renderer. To remove that texture and display the buildings using a specific color, apply a simple renderer containing a mesh symbol with the desired color. If the layer also contains attributes such as building usage, you can apply a renderer that generates a data-driven visualization. See Categorical data in 3D for an example of a data-driven visualization.
Switch between visualizing buildings using realistic textures and a plain color.
40 collapsed lines
<!doctype html><html> <head> <meta charset="utf-8" /> <title>Cities in 3D</title> <link rel="stylesheet" href="https://js.arcgis.com/5.1/esri/themes/light/main.css" /> <!-- Load the ArcGIS Maps SDK for JavaScript from CDN --> <script type="module" src="https://js.arcgis.com/5.1/"></script>
<style> html, body, #viewDiv { height: 100%; margin: 0; } .buttons { position: absolute; bottom: 20px; left: 0; right: 0; text-align: center; } .esri-button { display: inline; background-color: white; min-width: 200px; max-width: 300px; } </style>
<script type="module"> const [Map, SceneView, SceneLayer, FeatureLayer] = await $arcgis.import([ "@arcgis/core/Map.js", "@arcgis/core/views/SceneView.js", "@arcgis/core/layers/SceneLayer.js", "@arcgis/core/layers/FeatureLayer.js", ]);
const buildings3DObjects = new SceneLayer({ url: "https://services.arcgis.com/V6ZHFr6zdgNZuVG0/arcgis/rest/services/SF_BLDG_WSL1/SceneServer", renderer: { type: "simple", symbol: { type: "mesh-3d", symbolLayers: [ { type: "fill", material: { color: [255, 237, 204], colorMixMode: "replace", }, edges: { type: "solid", color: [133, 108, 62, 0.5], size: 1, }, }, ], }, }, });58 collapsed lines
// Create Map var map = new Map({ basemap: "gray-vector", ground: "world-elevation", layers: [buildings3DObjects], });
// Create the SceneView var view = new SceneView({ container: "viewDiv", map: map, camera: { position: [-122.39899666, 37.77940678, 314.88439], heading: 356.82, tilt: 78.61, }, });
document.getElementById("building").addEventListener("click", function (event) { buildings3DObjects.renderer = { type: "simple", symbol: { type: "mesh-3d", symbolLayers: [ { type: "fill", material: { color: [255, 237, 204], colorMixMode: "replace", }, edges: { type: "solid", color: [133, 108, 62, 0.5], size: 1, }, }, ], }, }; }); document.getElementById("textured").addEventListener("click", function (event) { buildings3DObjects.renderer = null; }); </script> </head>
<body> <div id="viewDiv"></div> <div class="buttons"> <button id="building" class="esri-button esri-button--secondary esri-button--half"> Untextured 3D buildings </button> <button id="textured" class="esri-button esri-button--secondary esri-button--half">Textured 3D buildings</button> </div> </body></html>Realistic city visualization
In this example, the city of Frankfurt is rendered with an integrated mesh layer. A feature layer that contains points of interest is added to the map. These points are placed relative to the scene, so that they are aligned to the height of the mesh. Additionally, callouts
38 collapsed lines
<!doctype html><html> <head> <meta charset="utf-8" /> <title>Realistic cities</title> <link rel="stylesheet" href="https://js.arcgis.com/5.1/esri/themes/light/main.css" /> <!-- Load the ArcGIS Maps SDK for JavaScript from CDN --> <script type="module" src="https://js.arcgis.com/5.1/"></script>
<style> html, body, #viewDiv { height: 100%; margin: 0; }
#menu { padding: 1em; } </style>
<script type="module"> const [Map, SceneView, IntegratedMeshLayer, LayerList, SceneLayer, Legend] = await $arcgis.import([ "@arcgis/core/Map.js", "@arcgis/core/views/SceneView.js", "@arcgis/core/layers/IntegratedMeshLayer.js", "@arcgis/core/widgets/LayerList.js", "@arcgis/core/layers/SceneLayer.js", "@arcgis/core/widgets/Legend.js", ]);
const map = new Map({ basemap: "satellite", ground: "world-elevation", });
const meshLayer = new IntegratedMeshLayer({ url: "https://tiles.arcgis.com/tiles/cFEFS0EWrhfDeVw9/arcgis/rest/services/Buildings_Frankfurt_2021/SceneServer/layers/0", copyright: "nFrames - Aerowest", title: "Integrated Mesh Frankfurt", });97 collapsed lines
const color = [235, 171, 52]; const poiLayer = new SceneLayer({ url: "https://services.arcgis.com/V6ZHFr6zdgNZuVG0/arcgis/rest/services/Frankfurt_POIs/SceneServer", title: "Points of interest", renderer: { type: "simple", symbol: { type: "point-3d", // autocasts as new PointSymbol3D() symbolLayers: [ { type: "icon", // autocasts as new IconSymbol3DLayer() resource: { primitive: "circle", }, size: 10, material: { color: color, }, outline: { color: "white", size: 1, }, }, ],
verticalOffset: { screenLength: 40, maxWorldLength: 200, minWorldLength: 35, },
callout: { type: "line", // autocasts as new LineCallout3D() color: color, size: 1, border: { color: "white", }, }, }, }, elevationInfo: { // elevation mode that will place points on top of the buildings or other SceneLayer 3D objects mode: "relative-to-scene", }, screenSizePerspectiveEnabled: false, labelingInfo: [ { labelExpressionInfo: { value: "{name}", }, symbol: { type: "label-3d", symbolLayers: [ { type: "text", material: { color: color, }, // we set a halo on the font to make the labels more visible with any kind of background halo: { size: 1, color: "white", }, size: 10, }, ], }, }, ], });
map.addMany([meshLayer, poiLayer]);
const view = new SceneView({ container: "viewDiv", map: map, camera: { position: [8.69370363, 50.10533415, 284.73511], heading: 295.75, tilt: 76.8, }, });
const layerList = new LayerList({ view: view, }); view.ui.add(layerList, "top-right"); </script> </head>
<body> <div id="viewDiv"></div> </body></html>Add real world city objects as 3D models
You can add individual city elements like trees, light posts, or benches as 3D model symbols for points. In this example, the cars, trees, and light posts are point geometries with a 3D model symbol. You can use your own 3D models in glTF™ format, or you can choose from the 3D models that Esri provides as web styles. These models are useful when your goal is to recreate a close-up visualization of an area in a city.
In the below example, you can add points with specific 3D model symbols. You can also align and resize the models to integrate with the environment. Click the Tree button and then click the location in the scene in which to place the tree 3D model. Next, drag the circle handler to resize it or rotate it.
To create a visualization like this:
- Add a point feature layer with attributes for the type of city object, the rotation, and the size.
- Set a unique value renderer that maps the type of city object to a 3D model symbol in the Esri web style library.
- Use visual variables to drive the size and the rotation by attributes in the point feature layers.
- Next, add a 3D object scene layer with textured buildings to increase the scene’s realism.
166 collapsed lines
<!doctype html><html> <head> <meta charset="utf-8" /> <title>Cities in 3D - models</title> <link rel="stylesheet" href="https://js.arcgis.com/5.1/esri/themes/light/main.css" /> <!-- Load the ArcGIS Maps SDK for JavaScript from CDN --> <script type="module" src="https://js.arcgis.com/5.1/"></script>
<style> html, body, #viewDiv { height: 100%; margin: 0; }
#extra { max-width: 300px; padding: 10px; background-color: rgba(255, 255, 255, 0.9); } </style>
<script type="module"> const [WebScene, SceneView, FeatureLayer, SceneLayer, GraphicsLayer, SketchViewModel] = await $arcgis.import([ "@arcgis/core/WebScene.js", "@arcgis/core/views/SceneView.js", "@arcgis/core/layers/FeatureLayer.js", "@arcgis/core/layers/SceneLayer.js", "@arcgis/core/layers/GraphicsLayer.js", "@arcgis/core/widgets/Sketch/SketchViewModel.js", ]);
// Create the web scene
const map = new WebScene({ basemap: "satellite", ground: "world-elevation", });
// Create the view const view = new SceneView({ container: "viewDiv", map: map, camera: { position: { latitude: 39.957011, longitude: -75.169457, z: 26, }, tilt: 78, heading: 315, }, environment: { lighting: { date: new Date("June 15, 2015 16:00:00 EDT"), directShadowsEnabled: true, }, }, });
/******************************************************************** * Add layer containing street furniture features: benches, street lamps ********************************************************************/
// convenience function to retrieve the WebStyleSymbols based on their name function getStreetSymbol(name) { return { type: "web-style", // autocasts as new WebStyleSymbol() name: name, styleName: "EsriRealisticStreetSceneStyle", }; }
// use a UniqueValueRenderer to symbolize the different feature types (street lamps, trash bin) const streetFurnitureRenderer = { type: "unique-value", // autocasts as new UniqueValueRenderer() field: "CATEGORY", defaultSymbol: getStreetSymbol("Light_On_Post_-_Light_on"), uniqueValueInfos: [ { value: "Overhanging street", symbol: getStreetSymbol("Overhanging_Street_-_Light_on"), }, { value: "Overhanging street and sidewalk", symbol: getStreetSymbol("Light_On_Post_-_Light_on"), }, { value: "Trash bin", symbol: getStreetSymbol("Trash_Bin_1"), }, { value: "Newspaper", symbol: getStreetSymbol("Newspaper_Vending_Machine"), }, { value: "Park bench 1", symbol: getStreetSymbol("Park_Bench_2"), }, ], visualVariables: [ { type: "rotation", field: "ROTATION", }, { type: "size", field: "SIZE", axis: "height", }, ], };
// create the layer and assign the renderer to it const streetFurnitureLayer = new FeatureLayer({ url: "https://services.arcgis.com/V6ZHFr6zdgNZuVG0/arcgis/rest/services/Philadelphia_LoganSquare_streetFurniture/FeatureServer/0", renderer: streetFurnitureRenderer, elevationInfo: { mode: "on-the-ground", }, });
/********************************************** * Add layer containing transportation features **********************************************/
// convenience object that maps feature attribute value to web style symbol name // will be used to create the uniqueValueInfos in the renderer const transportationSymbols = [ { value: "Bus", name: "Bus", }, { value: "Taxi", name: "Taxi", }, { value: "Ambulance", name: "Ambulance", }, { value: "Porsche", name: "Porsche_Carrera", }, { value: "Mercedes", name: "Mercedes_S-Class", }, { value: "Ford", name: "Ford_Edge", }, { value: "Audi", name: "Ford_Edge", }, { value: "Volkswagen", name: "Volkswagen_Jetta_Wagon", }, ];
const transportationLayer = new FeatureLayer({ url: "https://services.arcgis.com/V6ZHFr6zdgNZuVG0/arcgis/rest/services/Philadelphia_LoganSquare_cars/FeatureServer", outFields: ["ROTATION", "CATEGORY", "SIZE"], renderer: { type: "unique-value", // autocasts as new UniqueValueRenderer() field: "CATEGORY", uniqueValueInfos: transportationSymbols.map(function (type) { return { value: type.value, symbol: { type: "web-style", // autocasts as new WebStyleSymbol() name: type.name, styleName: "EsriRealisticTransportationStyle", }, }; }), visualVariables: [ { type: "rotation", // cars need to have a rotation field so that they are aligned to the street field: "ROTATION", }, { type: "size", field: "SIZE", axis: "depth", }, ], }, elevationInfo: { mode: "on-the-ground", }, });163 collapsed lines
/********************************************** * Add layer containing vegetation features **********************************************/
// define the unique values const uniqueValueInfos = [ { value: "Acer", symbol: { type: "web-style", // autocasts as new WebStyleSymbol() name: "Acer", styleName: "EsriRealisticTreesStyle", }, }, { value: "Bulbophyllum", symbol: { type: "web-style", // autocasts as new WebStyleSymbol() name: "Bulbophyllum", styleName: "EsriRealisticTreesStyle", }, }, { value: "Cornus", symbol: { type: "web-style", // autocasts as new WebStyleSymbol() name: "Cornus", styleName: "EsriRealisticTreesStyle", }, }, { value: "Pinus", symbol: { type: "web-style", // autocasts as new WebStyleSymbol() name: "Pinus", styleName: "EsriRealisticTreesStyle", }, }, ];
// define vegetationLayer const vegetationLayer = new FeatureLayer({ url: "https://services.arcgis.com/V6ZHFr6zdgNZuVG0/arcgis/rest/services/Philadelphia_LoganSquare_vegetation_selection/FeatureServer", elevationInfo: { mode: "on-the-ground", },
renderer: { type: "unique-value", // autocasts as new UniqueValueRenderer() field: "CATEGORY", defaultSymbol: { type: "web-style", // autocasts as new WebStyleSymbol() name: "Acer", styleName: "EsriRealisticTreesStyle", }, uniqueValueInfos: uniqueValueInfos, visualVariables: [ { type: "size", field: "SIZE", axis: "height", // take the real height of the plant from the SIZE field }, { type: "rotation", valueExpression: "random() * 360", // we use a random rotation, so that plants look different }, ], }, });
const buildings = new SceneLayer({ url: "https://tiles.arcgis.com/tiles/z2tnIkrLQ2BRzr6P/arcgis/rest/services/philadelphia_Bldgs_text_untex/SceneServer", elevationInfo: { mode: "absolute-height", offset: -6, }, });
map.addMany([streetFurnitureLayer, vegetationLayer, transportationLayer, buildings]);
view.ui.add("extra", "bottom-right");
const graphicsLayer = new GraphicsLayer({ elevationInfo: { mode: "on-the-ground" }, }); view.map.add(graphicsLayer);
const treeBtn = document.getElementById("tree"); const busBtn = document.getElementById("bus");
view .when(function () { // This sample uses the SketchViewModel to add points to a // GraphicsLayer. The points have 3D glTF models as symbols. const sketchVM = new SketchViewModel({ layer: graphicsLayer, view: view, });
treeBtn.addEventListener("click", function () { // reference the relative path to the glTF model // in the resource of an ObjectSymbol3DLayer sketchVM.pointSymbol = { type: "point-3d", symbolLayers: [ { type: "object", resource: { href: "https://static.arcgis.com/arcgis/styleItems/RealisticTrees/web/resource/AcerPlatanoides.json", }, }, ], }; sketchVM.create("point"); this.classList.add("esri-button--secondary"); });
busBtn.addEventListener("click", function () { // reference the relative path to the glTF model // in the resource of an ObjectSymbol3DLayer sketchVM.pointSymbol = { type: "point-3d", symbolLayers: [ { type: "object", resource: { href: "https://static.arcgis.com/arcgis/styleItems/RealisticTransportation/web/resource/Bus.json", }, }, ], }; sketchVM.create("point"); this.classList.add("esri-button--secondary"); });
sketchVM.on("create", function (event) { if (event.state === "complete") { sketchVM.update(event.graphic); } }); }) .catch(console.error); </script> </head>
<body> <div id="viewDiv"></div> <div id="extra" class="esri-widget"> <p>Select a symbol and place it in the scene:</p> <button id="tree" class="esri-button">Tree</button><br /> <button id="bus" class="esri-button">Bus</button> <p> Discover more 3D symbols in the <a href="/visualization/symbols-color-ramps/esri-web-style-symbols-3d/" target="_blank" >Esri 3D Web Style Symbols</a > list. </p> </div> </body></html>