Display custom labels on a feature layer.
Use case
Labeling features is useful to visually display a key piece of information or attribute of a feature on a map. For example, you may want to label rivers or streets with their names.
How to use the sample
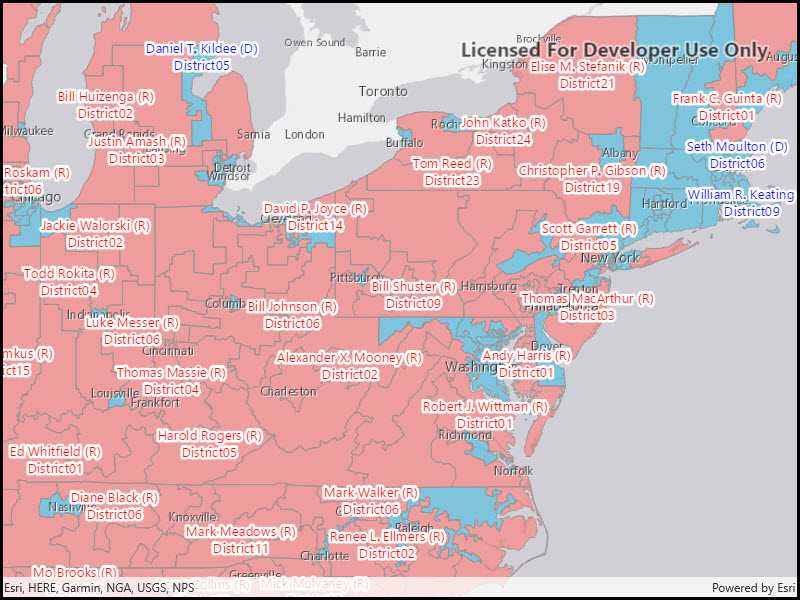
Pan and zoom around the United States. Labels for congressional districts will be shown in red for Republican districts and blue for Democrat districts. Notice how labels pop into view as you zoom in.
How it works
- Create a
ServiceFeatureTableusing a feature service URL. - Create a
FeatureLayerfrom the service feature table. - Create a
TextSymbolto use for displaying the label text. - Create an
ArcadeLabelExpressionfor the label definition.- You can use fields of the feature by using
$feature.field_namein the expression.
- You can use fields of the feature by using
- Create a new
LabelDefinitionfrom the arcade label expression and text symbol. - Add the definition to the feature layer with
featureLayer.LabelDefinitions.Add(labelDefinition). - Lastly, enable labels on the layer using
featureLayer.LabelsEnabled.
Relevant API
- ArcadeLabelExpression
- FeatureLayer
- LabelDefinition
- TextSymbol
About the data
This sample uses the USA 116th Congressional Districts feature layer hosted on ArcGIS Online.
Additional information
Help regarding the Arcade label expression script for defining a label definition can be found on the ArcGIS Developers site.
Tags
arcade, attribute, deconfliction, label, labeling, string, symbol, text, visualization
Sample Code
<UserControl
x:Class="ArcGIS.UWP.Samples.ShowLabelsOnLayer.ShowLabelsOnLayer"
x:Name="_this"
xmlns="http://schemas.microsoft.com/winfx/2006/xaml/presentation"
xmlns:x="http://schemas.microsoft.com/winfx/2006/xaml"
xmlns:esriUI="using:Esri.ArcGISRuntime.UI.Controls">
<Grid>
<esriUI:MapView x:Name="MyMapView" />
</Grid>
</UserControl>