Query a feature table for statistics, grouping and sorting by different fields.
Use case
You can use statistical queries, grouping and sorting to process large amounts of data saved in feature tables. This is helpful for identifying trends and relationships within the data, which can be used to support further interpretations and decisions. For example, a health agency can use information on medical conditions occurring throughout a country to identify at-risk areas or demographics, and decide on further action and preventive measures.
How to use the sample
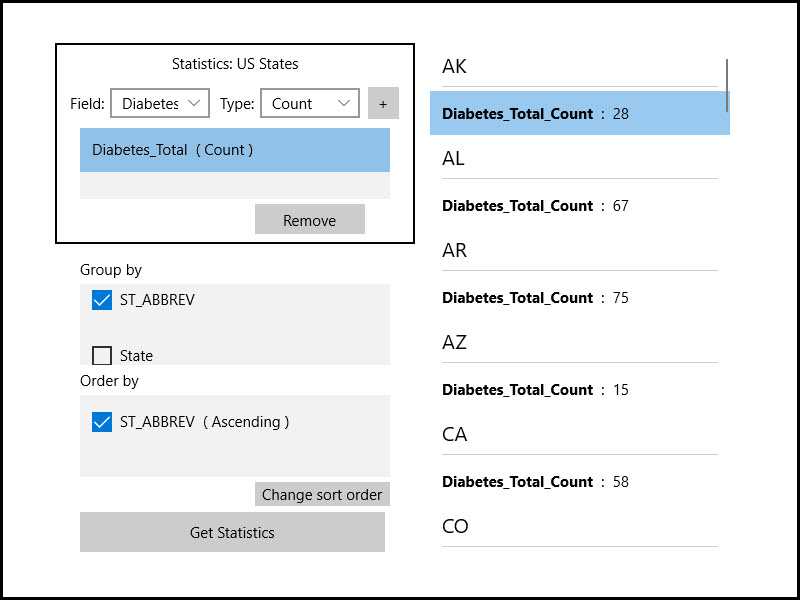
The sample will start with some default options selected. You can immediately click the "Get Statistics" button to see the results for these options. There are several ways to customize your queries:
- You can add statistic definitions to the top-left table using the combo boxes and "Add" button. Select a table row and click "Remove" to remove a definition.
- To change the Group-by fields, check the box by the field you want to group by in the bottom-left list view.
- To change the Order-by fields, select a Group-by field (it must be checked) and click the ">>" button to add it to the Order-by table. To remove a field from the Order-by table, select it and click the "<<" button. To change the sort order of the Order-by field, the cells of the "Sort Order" column are combo-boxes that may be either ASCENDING or DESCENDING.
How it works
- Create a
ServiceFeatureTableusing the URL of a feature service and load the table. - Get the feature tables field names list with
featureTable.Fields. - Create
StatisticDefinitions specifying the field to compute statistics on and theStatisticTypeto compute. - Create
StatisticsQueryParameterspassing in the list of statistic definitions. - To have the results grouped by fields, add the field names to the query parameters'
GroupByFieldNamescollection. - To have the results ordered by fields, create
OrderBys, specifying the field name andSortOrder. Pass theseOrderBys to the parameters'OrderByFieldscollection. - To execute the query, call
featureTable.QueryStatisticsAsync(queryParameters). - Get the
StatisticQueryResult. From this, you can get an iterator ofStatisticRecords to loop through and display.
Relevant API
- Field
- OrderBy
- QueryParameters
- ServiceFeatureTable
- StatisticDefinition
- StatisticRecord
- StatisticsQueryParameters
- StatisticsQueryResult
- StatisticType
About the data
This sample uses a Diabetes, Obesity, and Inactivity by US County feature layer hosted on ArcGIS Online.
Tags
correlation, data, fields, filter, group, sort, statistics, table
Sample Code
<UserControl
x:Class="ArcGIS.UWP.Samples.StatsQueryGroupAndSort.StatsQueryGroupAndSort"
xmlns="http://schemas.microsoft.com/winfx/2006/xaml/presentation"
xmlns:x="http://schemas.microsoft.com/winfx/2006/xaml"
xmlns:local="using:ArcGIS.UWP.Samples.StatsQueryGroupAndSort">
<UserControl.Resources>
<CollectionViewSource
x:Name="GroupedResultData"
IsSourceGrouped="True"
Source="{Binding GroupedStatistics}" />
<local:StringFormatConverter x:Key="StringFormatter" />
</UserControl.Resources>
<Grid
MinWidth="300"
MinHeight="300"
MaxWidth="800"
MaxHeight="800"
HorizontalAlignment="Center"
VerticalAlignment="Center">
<Grid.ColumnDefinitions>
<ColumnDefinition Width="50" />
<ColumnDefinition Width="110" />
<ColumnDefinition Width="40" />
<ColumnDefinition Width="110" />
<ColumnDefinition Width="50" />
<ColumnDefinition />
</Grid.ColumnDefinitions>
<Grid.RowDefinitions>
<RowDefinition Height="40" />
<RowDefinition Height="40" />
<RowDefinition Height="*" MinHeight="50" />
<RowDefinition Height="40" />
<RowDefinition Height="40" />
<RowDefinition Height="*" MinHeight="50" />
<RowDefinition Height="30" />
<RowDefinition Height="*" MinHeight="50" />
<RowDefinition Height="30" />
<RowDefinition Height="50" MinHeight="50" />
<RowDefinition />
</Grid.RowDefinitions>
<Border
Grid.Row="0"
Grid.RowSpan="4"
Grid.Column="0"
Grid.ColumnSpan="5"
BorderBrush="Black"
BorderThickness="2" />
<TextBlock
Grid.Row="0"
Grid.Column="1"
Grid.ColumnSpan="3"
HorizontalAlignment="Center"
VerticalAlignment="Center"
Text="Statistics: US States" />
<TextBlock
Grid.Row="1"
HorizontalAlignment="Right"
VerticalAlignment="Center"
Text="Field:" />
<ComboBox
x:Name="FieldsComboBox"
Grid.Row="1"
Grid.Column="1"
Margin="5"
HorizontalAlignment="Stretch"
VerticalAlignment="Center">
<ComboBox.ItemTemplate>
<DataTemplate>
<TextBlock Text="{Binding Name}" />
</DataTemplate>
</ComboBox.ItemTemplate>
</ComboBox>
<TextBlock
Grid.Row="1"
Grid.Column="2"
HorizontalAlignment="Right"
VerticalAlignment="Center"
Text="Type:" />
<ComboBox
x:Name="StatTypeComboBox"
Grid.Row="1"
Grid.Column="3"
Margin="5"
HorizontalAlignment="Stretch"
VerticalAlignment="Center" />
<Button
x:Name="AddStatisticButton"
Grid.Row="1"
Grid.Column="4"
Margin="3"
Click="AddStatisticClicked"
Content="+" />
<ScrollViewer
Grid.Row="2"
Grid.ColumnSpan="5"
Margin="25,5">
<ListBox x:Name="StatFieldsListBox" Height="120">
<ListBox.ItemTemplate>
<DataTemplate>
<TextBlock>
<Run Text="{Binding OnFieldName}" />
<Run Text=" (" />
<Run Text="{Binding StatisticType}" />
<Run Text=")" />
</TextBlock>
</DataTemplate>
</ListBox.ItemTemplate>
</ListBox>
</ScrollViewer>
<Button
x:Name="RemoveStatField"
Grid.Row="3"
Grid.Column="3"
Height="30"
HorizontalAlignment="Stretch"
VerticalAlignment="Top"
Click="RemoveStatisticClicked"
Content="Remove" />
<TextBlock
Grid.Row="4"
Grid.ColumnSpan="2"
Margin="25,0,0,5"
HorizontalAlignment="Left"
VerticalAlignment="Bottom"
Text="Group by" />
<ListBox
x:Name="GroupFieldsListBox"
Grid.Row="5"
Grid.ColumnSpan="5"
MinHeight="110"
Margin="25,0"
HorizontalAlignment="Stretch"
VerticalAlignment="Stretch">
<ListBox.ItemTemplate>
<DataTemplate>
<StackPanel Orientation="Horizontal">
<CheckBox
Checked="GroupFieldCheckChanged"
Content="{Binding Name}"
Unchecked="GroupFieldCheckChanged" />
</StackPanel>
</DataTemplate>
</ListBox.ItemTemplate>
</ListBox>
<TextBlock
Grid.Row="6"
Grid.ColumnSpan="2"
Margin="25,0,0,5"
HorizontalAlignment="Left"
VerticalAlignment="Bottom"
Text="Order by" />
<ListBox
x:Name="OrderByFieldsListBox"
Grid.Row="7"
Grid.ColumnSpan="5"
MinHeight="110"
Margin="25,0"
HorizontalAlignment="Stretch"
VerticalAlignment="Stretch">
<ListBox.ItemTemplate>
<DataTemplate>
<StackPanel Orientation="Horizontal">
<CheckBox IsChecked="{Binding OrderWith}">
<CheckBox.Content>
<TextBlock>
<Run Text="{Binding OrderInfo.FieldName}" />
<Run Text=" (" />
<Run Text="{Binding OrderInfo.SortOrder}" />
<Run Text=")" />
</TextBlock>
</CheckBox.Content>
</CheckBox>
</StackPanel>
</DataTemplate>
</ListBox.ItemTemplate>
</ListBox>
<Button
x:Name="SortOrderButton"
Grid.Row="8"
Grid.Column="3"
Grid.ColumnSpan="2"
Margin="0,5,25,0"
Padding="5,0"
HorizontalAlignment="Center"
VerticalAlignment="Top"
Click="ChangeFieldSortOrder"
Content="Change sort order" />
<Button
x:Name="GetStatisticsButton"
Grid.Row="9"
Grid.Column="0"
Grid.ColumnSpan="5"
Height="40"
Margin="25,5,30,5"
Padding="10,0"
HorizontalAlignment="Stretch"
VerticalAlignment="Stretch"
Click="OnExecuteStatisticsQueryClicked"
Content="Get Statistics" />
<Grid
x:Name="SmallResultsPanel"
Grid.Row="10"
Grid.ColumnSpan="5"
Margin="25,0">
<ListView ItemsSource="{Binding Source={StaticResource GroupedResultData}}">
<ListView.GroupStyle>
<GroupStyle>
<GroupStyle.HeaderTemplate>
<DataTemplate>
<TextBlock Text="{Binding Key}" />
</DataTemplate>
</GroupStyle.HeaderTemplate>
</GroupStyle>
</ListView.GroupStyle>
<ListView.ItemTemplate>
<DataTemplate>
<ItemsControl ItemsSource="{Binding}">
<ItemsControl.ItemTemplate>
<DataTemplate>
<TextBlock HorizontalAlignment="Left">
<Run FontWeight="Bold" Text="{Binding Key}" />
<Run Text=" : " />
<Run Text="{Binding Value, Converter={StaticResource StringFormatter}, ConverterParameter='{}{0:0,0}'}" />
</TextBlock>
</DataTemplate>
</ItemsControl.ItemTemplate>
</ItemsControl>
</DataTemplate>
</ListView.ItemTemplate>
</ListView>
</Grid>
<Grid
x:Name="LargeResultsPanel"
Grid.Row="0"
Grid.RowSpan="10"
Grid.Column="5"
Margin="15,0">
<ListView Width="300" ItemsSource="{Binding Source={StaticResource GroupedResultData}}">
<ListView.GroupStyle>
<GroupStyle>
<GroupStyle.HeaderTemplate>
<DataTemplate>
<TextBlock Text="{Binding Key}" />
</DataTemplate>
</GroupStyle.HeaderTemplate>
</GroupStyle>
</ListView.GroupStyle>
<ListView.ItemTemplate>
<DataTemplate>
<ItemsControl ItemsSource="{Binding}">
<ItemsControl.ItemTemplate>
<DataTemplate>
<TextBlock HorizontalAlignment="Left">
<Run FontWeight="Bold" Text="{Binding Key}" />
<Run Text=" : " />
<Run Text="{Binding Value, Converter={StaticResource StringFormatter}, ConverterParameter='{}{0:0,0}'}" />
</TextBlock>
</DataTemplate>
</ItemsControl.ItemTemplate>
</ItemsControl>
</DataTemplate>
</ListView.ItemTemplate>
</ListView>
</Grid>
<!--
============================
Adaptive triggers
============================
-->
<VisualStateManager.VisualStateGroups>
<VisualStateGroup>
<!--
============================
Handle screen less than 720 effective pixels
============================
-->
<VisualState>
<VisualState.StateTriggers>
<AdaptiveTrigger MinWindowWidth="0" />
</VisualState.StateTriggers>
<VisualState.Setters>
<Setter Target="SmallResultsPanel.Visibility" Value="Visible" />
<Setter Target="LargeResultsPanel.Visibility" Value="Collapsed" />
</VisualState.Setters>
</VisualState>
<!--
============================
Handle screen over 720 effective pixels
============================
-->
<VisualState>
<VisualState.StateTriggers>
<AdaptiveTrigger MinWindowWidth="720" />
</VisualState.StateTriggers>
<VisualState.Setters>
<Setter Target="SmallResultsPanel.Visibility" Value="Collapsed" />
<Setter Target="LargeResultsPanel.Visibility" Value="Visible" />
</VisualState.Setters>
</VisualState>
</VisualStateGroup>
</VisualStateManager.VisualStateGroups>
</Grid>
</UserControl>