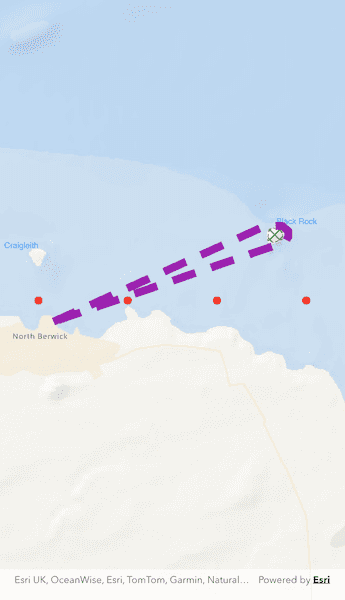
Use a symbol style to display a graphic on a graphics overlay.

Use case
Allows you to customize a graphic by assigning a unique symbol. For example, you may wish to display individual graphics for different landmarks across a region, and to style each one with a unique symbol.
How to use the sample
Pan and zoom around the map. Observe the graphics on the map.
How it works
- Create a
GraphicsOverlayand add it to theArcGISMapView. - Create a
ArcGISSymbolsuch asSimpleMarkerSymbol,SimpleLineSymbolorSimpleFillSymbol. - Create a
Graphic, specifying aGeometryand aArcGISSymbol. - Add the
Graphicto theGraphicsOverlay.
Relevant API
- Geometry
- Graphic
- GraphicsOverlay
- SimpleFillSymbol
- SimpleLineSymbol
- SimpleMarkerSymbol
Tags
display, fill, graphics, line, marker, overlay, point, symbol
Sample Code
style_graphics_with_symbols.dart
// Copyright 2024 Esri
//
// Licensed under the Apache License, Version 2.0 (the "License");
// you may not use this file except in compliance with the License.
// You may obtain a copy of the License at
//
// https://www.apache.org/licenses/LICENSE-2.0
//
// Unless required by applicable law or agreed to in writing, software
// distributed under the License is distributed on an "AS IS" BASIS,
// WITHOUT WARRANTIES OR CONDITIONS OF ANY KIND, either express or implied.
// See the License for the specific language governing permissions and
// limitations under the License.
//
import 'package:arcgis_maps/arcgis_maps.dart';
import 'package:arcgis_maps_sdk_flutter_samples/common/common.dart';
import 'package:flutter/material.dart';
class StyleGraphicsWithSymbols extends StatefulWidget {
const StyleGraphicsWithSymbols({super.key});
@override
State<StyleGraphicsWithSymbols> createState() =>
_StyleGraphicsWithSymbolsState();
}
class _StyleGraphicsWithSymbolsState extends State<StyleGraphicsWithSymbols>
with SampleStateSupport {
// Create a controller for the map view.
final _mapViewController = ArcGISMapView.createController();
// A flag for when the map view is ready and controls can be used.
var _ready = false;
final _graphicsOverlay = GraphicsOverlay();
@override
Widget build(BuildContext context) {
return Scaffold(
body: Stack(
children: [
ArcGISMapView(
controllerProvider: () => _mapViewController,
onMapViewReady: onMapViewReady,
),
// Display a progress indicator and prevent interaction until state is ready.
LoadingIndicator(visible: !_ready),
],
),
);
}
void onMapViewReady() {
// Create the map.
final map = ArcGISMap.withBasemapStyle(BasemapStyle.arcGISOceans);
// Create a point using x and y coordinates.
final point = ArcGISPoint(
x: 56.075844,
y: -2.681572,
spatialReference: SpatialReference.wgs84,
);
// Set the initial viewpoint of the map to the point and provide a scale.
map.initialViewpoint = Viewpoint.fromCenter(point, scale: 2000);
// Set the map to the mapview controller.
_mapViewController.arcGISMap = map;
// Add graphics overlay to the mapview controller.
_mapViewController.graphicsOverlays.add(_graphicsOverlay);
// Call functions to create the graphics.
_createPoints();
_createPolyline();
_createPolygon();
_createText();
// Update the extent to encompass all of the symbols.
_setExtent();
// Set the ready state variable to true to enable the sample UI.
setState(() => _ready = true);
}
void _createPoints() {
// Create a red circle simple marker symbol.
final redCircleSymbol = SimpleMarkerSymbol(color: Colors.red, size: 10);
// Create graphics and add them to graphics overlay.
var graphic = Graphic(
geometry: ArcGISPoint(
x: -2.72,
y: 56.065,
spatialReference: SpatialReference.wgs84,
),
symbol: redCircleSymbol,
);
_graphicsOverlay.graphics.add(graphic);
graphic = Graphic(
geometry: ArcGISPoint(
x: -2.69,
y: 56.065,
spatialReference: SpatialReference.wgs84,
),
symbol: redCircleSymbol,
);
_graphicsOverlay.graphics.add(graphic);
graphic = Graphic(
geometry: ArcGISPoint(
x: -2.66,
y: 56.065,
spatialReference: SpatialReference.wgs84,
),
symbol: redCircleSymbol,
);
_graphicsOverlay.graphics.add(graphic);
graphic = Graphic(
geometry: ArcGISPoint(
x: -2.63,
y: 56.065,
spatialReference: SpatialReference.wgs84,
),
symbol: redCircleSymbol,
);
_graphicsOverlay.graphics.add(graphic);
}
void _createPolyline() {
// Create a purple simple line symbol.
final lineSymbol = SimpleLineSymbol(
style: SimpleLineSymbolStyle.dash,
color: Colors.purple,
width: 10,
);
// Build a polyline.
final polylineBuilder = PolylineBuilder(
spatialReference: SpatialReference.wgs84,
);
polylineBuilder.addPointXY(x: -2.715, y: 56.061);
polylineBuilder.addPointXY(x: -2.6438, y: 56.079);
polylineBuilder.addPointXY(x: -2.638, y: 56.079);
polylineBuilder.addPointXY(x: -2.636, y: 56.078);
polylineBuilder.addPointXY(x: -2.636, y: 56.077);
polylineBuilder.addPointXY(x: -2.637, y: 56.076);
polylineBuilder.addPointXY(x: -2.715, y: 56.061);
final polyline = polylineBuilder.toGeometry();
// Create the graphic with polyline and symbol.
final graphic = Graphic(geometry: polyline, symbol: lineSymbol);
// Add graphic to the graphics overlay.
_graphicsOverlay.graphics.add(graphic);
}
void _createPolygon() {
// Create a green dash line symbol.
final outlineSymbol = SimpleLineSymbol(
style: SimpleLineSymbolStyle.dash,
color: Colors.green,
);
// Create a green mesh simple fill symbol.
final fillSymbol = SimpleFillSymbol(
style: SimpleFillSymbolStyle.diagonalCross,
color: Colors.green,
outline: outlineSymbol,
);
// Create a new point collection for polygon.
final polygonBuilder = PolygonBuilder(
spatialReference: SpatialReference.wgs84,
);
polygonBuilder.addPointXY(x: -2.6425, y: 56.0784);
polygonBuilder.addPointXY(x: -2.6430, y: 56.0763);
polygonBuilder.addPointXY(x: -2.6410, y: 56.0759);
polygonBuilder.addPointXY(x: -2.6380, y: 56.0765);
polygonBuilder.addPointXY(x: -2.6380, y: 56.0784);
polygonBuilder.addPointXY(x: -2.6410, y: 56.0786);
final polygon = polygonBuilder.toGeometry();
// Create the graphic with polygon and symbol.
final graphic = Graphic(geometry: polygon, symbol: fillSymbol);
// Add graphic to the graphics overlay.
_graphicsOverlay.graphics.add(graphic);
}
void _createText() {
// Create two text symbols.
final bassRockTextSymbol = TextSymbol(
text: 'Black Rock',
color: Colors.blue,
size: 10,
horizontalAlignment: HorizontalAlignment.left,
verticalAlignment: VerticalAlignment.bottom,
);
final craigleithTextSymbol = TextSymbol(
text: 'Craigleith',
color: Colors.blue,
size: 10,
horizontalAlignment: HorizontalAlignment.right,
verticalAlignment: VerticalAlignment.top,
);
// Create two points.
final bassPoint = ArcGISPoint(
x: -2.64,
y: 56.079,
spatialReference: SpatialReference.wgs84,
);
final craigleithPoint = ArcGISPoint(
x: -2.72,
y: 56.076,
spatialReference: SpatialReference.wgs84,
);
// Create two graphics from the points and symbols.
final bassRockGraphic = Graphic(
geometry: bassPoint,
symbol: bassRockTextSymbol,
);
final craigleithGraphic = Graphic(
geometry: craigleithPoint,
symbol: craigleithTextSymbol,
);
// Add graphics to the graphics overlay.
_graphicsOverlay.graphics.addAll([bassRockGraphic, craigleithGraphic]);
}
Future<void> _setExtent() async {
// Create a new envelope builder using the same spatial reference as the graphics.
final myEnvelopeBuilder = EnvelopeBuilder(
spatialReference: SpatialReference.wgs84,
);
// Loop through each graphic in the graphic collection.
for (final graphic in _graphicsOverlay.graphics) {
// Union the extent of each graphic in the envelope builder.
myEnvelopeBuilder.unionWithEnvelope(graphic.geometry!.extent);
}
// Expand the envelope builder by 30%.
myEnvelopeBuilder.expandBy(1.3);
// Adjust the viewable area of the map to encompass all of the graphics in the
// graphics overlay plus an extra 30% margin for better viewing.
await _mapViewController.setViewpointAnimated(
Viewpoint.fromTargetExtent(myEnvelopeBuilder.extent),
);
}
}