Hide Table of Contents
View ReportPlayer - Geoenrichment sample in sandbox
ReportPlayer - Geoenrichment

Description

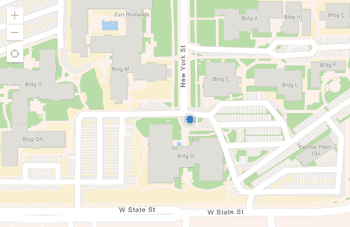
The ReportPlayer widget runs infographic report templates for a provided analysis area. This sample allows users to click on one of 4 locations and show one of the Esri provided Infographics for the location. TheReportPlayeruses the GeoEnrichment service to request and create the Infographic.GeoEnrichmentis a subscription based service available through ArcGIS Online. Log-in credentials are always required when executing a GeoEnrichment task.

Reportplayer sample


For demo purposes, this sample requires a user to have ArcGIS Online credentials with access to GeoEnrichment to run successfully.

Code

<!DOCTYPE html>
<html xmlns="http://www.w3.org/1999/xhtml">

<head>
 
<meta http-equiv="Content-Type" content="text/html; charset=utf-8">
 
<meta name="viewport" content="initial-scale=1, maximum-scale=1,user-scalable=no">
 
<title>GeoEnnrichment ReportPlayer</title>

 
<link rel="stylesheet" href="https://js.arcgis.com/3.46/dijit/themes/claro/claro.css">
 
<link rel="stylesheet" href="https://js.arcgis.com/3.46/esri/css/esri.css">

 
<style>
    html
,
    body
{
      padding
: 0;
      margin
: 0;
      height
: 100%;
      overflow
: hidden;
      font
-size: 13px;
      font
-family: "Avenir Next";
   
}

   
.topToolbar {
      background
-color: #EEEEEE;
      border
-bottom: 1px solid #b2b2b2;
      padding
: 10px;
   
}

   
.topToolbarLabel {
      margin
-right: 10px;
      margin
-top: 10px;
      margin
-bottom: 10px;
   
}

   
.topToolbarItem {
      margin
-right: 50px;
   
}

   
.topToolbarItem div {
      vertical
-align: top;
   
}

   
#mapDiv {
      position
: absolute;
      top
: 0px;
      left
: 0px;
      bottom
: 0px;
      right
: 0px;
   
}

   
.playerDivFullScreen {
      position
: absolute;
      top
: 0;
      left
: 0;
      bottom
: 0;
      right
: 0;
   
}

   
.playerDivInfoWindow {
      padding
: 10px;
   
}

   
.simpleInfoWindow.playerInfoWindow {
      width
: auto !important;
      height
: auto !important;
   
}

   
.simpleInfoWindow.playerInfoWindow .title {
      display
: none;
   
}

   
.simpleInfoWindow.playerInfoWindow .content {
      width
: auto !important;
      height
: auto !important;
   
}

   
.simpleInfoWindow.playerInfoWindow .close {
      left
: auto !important;
      right
: -12px;
   
}

   
.selectionBox {
      position
: absolute;
      border
: 1px solid gray;
      background
-color: rgba(0, 0, 0, 0.3);
   
}
 
</style>
 
<script src="https://js.arcgis.com/3.46/"></script>

 
<script>
    require
(["require"],
     
function (relativeRequire) {

        require
([
           
"dojo/aspect",
           
"dojo/dom-class",
           
"dojo/dom-construct",
           
"dojo/dom-geometry",
           
"dojo/dom-style",
           
"dojo/on",
           
"dojo/sniff",

           
"esri/map",
           
"esri/graphic",
           
"esri/geometry/Extent",
           
"esri/geometry/ScreenPoint",
           
"esri/layers/GraphicsLayer",
           
"esri/dijit/InfoWindowLite",

           
"esri/dijit/geoenrichment/OnDemandSelect",

           
"esri/dijit/geoenrichment/ReportPlayer/ReportPlayer",
           
"esri/dijit/geoenrichment/ReportPlayer/PlayerResizeModes",
           
"esri/dijit/geoenrichment/ReportPlayer/PlayerViewModes",
           
"esri/dijit/geoenrichment/ReportPlayer/dataProvider/supportClasses/StandardGraphicReportTemplates",
           
"esri/dijit/geoenrichment/ReportPlayer/core/supportClasses/map/symbols/HighlightedSymbolGenerator",
           
"esri/dijit/geoenrichment/utils/signIn/SignInHelper",
           
"esri/dijit/geoenrichment/utils/DeviceUtil",

           
"dojo/domReady!"
         
],
         
function (
            aspect
,
            domClass
,
            domConstruct
,
            domGeom
,
            domStyle
,
            on
,
            has
,

           
Map,
           
Graphic,
           
Extent,
           
ScreenPoint,
           
GraphicsLayer,
           
InfoWindowLite,

           
OnDemandSelect,

           
ReportPlayer,
           
PlayerResizeModes,
           
PlayerViewModes,
           
StandardGraphicReportTemplates,
           
HighlightedSymbolGenerator,
           
SignInHelper,
           
DeviceUtil
         
) {

           
var DEFAULTS = {
              portalUrl
: "https://www.arcgis.com",
              countryID
: "US",
           
};

           
var isMobile = DeviceUtil.isMobileDevice();

            topToolbarHelperText
.innerHTML = isMobile ?
             
"Select a template, then tap a feature on the map to open an infographic." :
             
"Select a template, then click a feature or shift-drag to select multiple features on the map to open an infographic.";

           
//--------------------------------------------------------------------------
           
//
           
//  Top Toolbar
           
//
           
//--------------------------------------------------------------------------

           
var templateSelector = new OnDemandSelect({
              listClass
: "esriGEOnDemandSelectUnlimitedTallList esriGEOnDemandSelectSpacedOut",
              value
: StandardGraphicReportTemplates.aliasToID("US", "key-facts"),
              options
: StandardGraphicReportTemplates.getListOptions("US")
           
}).placeAt(templateSelectorDiv);

           
var viewModeSelector = new OnDemandSelect({
              listClass
: "esriGEOnDemandSelectSpacedOut"
           
}).placeAt(viewModeSelectorDiv);
           
if (isMobile) {
              viewModeSelector
.set("options", [{
                  value
: PlayerViewModes.PANELS_IN_SLIDES,
                  label
: "Slide view"
               
},
               
{
                  value
: PlayerViewModes.PANELS_IN_STACK,
                  label
: "Stacked slide view"
               
}
             
]);
              viewModeSelector
.set("value", PlayerViewModes.PANELS_IN_SLIDES);
           
} else {
              viewModeSelector
.set("options", [{
                  value
: PlayerViewModes.FULL_PAGES,
                  label
: "Full screen"
               
},
               
{
                  value
: PlayerViewModes.PANELS_IN_SLIDES,
                  label
: "Slide view"
               
},
               
{
                  value
: PlayerViewModes.PANELS_IN_STACK,
                  label
: "Stacked slide view"
               
}
             
]);
              viewModeSelector
.set("value", PlayerViewModes.FULL_PAGES);
           
}

           
//--------------------------------------------------------------------------
           
//
           
//  Map
           
//
           
//--------------------------------------------------------------------------

            mapDiv
.style.top = topToolbarDiv.clientHeight + 1 + "px";

            on
(window, "resize", function () {
              mapDiv
.style.top = topToolbarDiv.clientHeight + 1 + "px";
           
});

           
var map = new Map("mapDiv", {
              basemap
: "streets-vector",
              center
: [-117.15, 32.68], // longitude, latitude
              zoom
: 11
           
});

            map
.on("load", function () {

             
// set up the map

              map
.disableRubberBandZoom();

             
var selectionBox;

             
// set up multiple selection

             
// here we need to detect mouse-down + Shift key
              on
(map, "mouse-down", function (event) {
               
if (!event.shiftKey)
                 
return;

                map
.disablePan();

                event
.stopPropagation();

               
function updateBox() {
                 
var sp = boxParams.startScreenPoint;
                 
var ep = boxParams.endScreenPoint;
                 
var xmin = Math.min(sp.x, ep.x);
                 
var ymin = Math.min(sp.y, ep.y);
                 
var xmax = Math.max(sp.x, ep.x);
                 
var ymax = Math.max(sp.y, ep.y);

                  domStyle
.set(selectionBox, {
                    left
: xmin + "px",
                    top
: ymin + "px",
                    width
: (xmax - xmin) + "px",
                    height
: (ymax - ymin) + "px"
                 
});
               
};

               
// create box
                selectionBox
= domConstruct.create("div", {
                 
"class": "selectionBox"
               
}, document.body);

               
// initial box params

               
var boxParams = {};
                boxParams
.startMapPoint = event.mapPoint;
                boxParams
.startScreenPoint = {
                  x
: event.clientX,
                  y
: event.clientY
               
};
                boxParams
.endScreenPoint = {
                  x
: event.clientX,
                  y
: event.clientY
               
};

               
// update box on mousemove

               
var boxToolMapHanlders = [];
                boxToolMapHanlders
.push(on(document.body, "mousemove, touchmove, dojotouchmove", function (
                  e
) {
                  boxParams
.endScreenPoint.x = e.clientX;
                  boxParams
.endScreenPoint.y = e.clientY;
                  updateBox
();
               
}));

               
// stop selection on mouseup

                boxToolMapHanlders
.push(on(document.body, "mouseup, touchend", function () {
                 
// try to calculate box extent
                 
var sp = boxParams.startMapPoint;
                 
var mapPos = domGeom.position(map.root);

                 
// give it a few pixels offset to aviod having a zero extent box
                 
if (boxParams.startScreenPoint.x === boxParams.endScreenPoint.x)
                    boxParams
.endScreenPoint.x += 2; // 2 pixels

                 
if (boxParams.startScreenPoint.y === boxParams.endScreenPoint.y)
                    boxParams
.endScreenPoint.y += 2; // 2 pixels

                 
var ep = map.toMap(new ScreenPoint(boxParams.endScreenPoint.x - mapPos.x, boxParams
                   
.endScreenPoint.y - mapPos.y));

                 
var xmin = Math.min(sp.x, ep.x);
                 
var ymin = Math.min(sp.y, ep.y);
                 
var xmax = Math.max(sp.x, ep.x);
                 
var ymax = Math.max(sp.y, ep.y);

                 
var boxExtent = new Extent(xmin, ymin, xmax, ymax, map.spatialReference);

                 
var graphics = graphicsLayer.graphics.filter(function (g) {
                   
return boxExtent.intersects(g.geometry);
                 
});
                  graphics
.length && runPlayerForSelectedGraphics(graphics, event.mapPoint);

                  boxToolMapHanlders
.forEach(function (h) {
                    h
.remove();
                 
})
                  boxToolMapHanlders
.length = 0;

                  domConstruct
.destroy(selectionBox);

                  map
.enablePan();

                 
// pointer, in this case the PointerEvents class thinks the mouse is still pressed and this causes issues
                 
// with future mouse clicks.  Set _numTouches to 0 in order to resolve this.
                 
if (has("ie"))
                   
if (map.navigationManager.pointerEvents)
                      map
.navigationManager.pointerEvents._numTouches = 0;
               
}));
             
});

             
// add a few graphics

             
var graphicsLayer = new GraphicsLayer();
              map
.addLayer(graphicsLayer);

              graphicsLayer
.add(new Graphic({
               
"geometry": {
                 
"rings": [
                   
[
                     
[-13037494.994088652, 3852956.928906343],
                     
[-13034724.151813319, 3853912.3917599064],
                     
[-13034208.201872393, 3853415.5510760536],
                     
[-13033720.915817076, 3852345.4326800625],
                     
[-13033224.075133225, 3850874.019885575],
                     
[-13032736.789077906, 3850138.313488331],
                     
[-13036052.245179772, 3849135.0774920895],
                     
[-13037494.994088652, 3852956.928906343]
                   
]
                 
],
                 
"spatialReference": {
                   
"wkid": 102100
                 
}
               
},
               
"symbol": {
                 
"type": "esriSFS",
                 
"style": "esriSFSSolid",
                 
"color": [199, 55, 36, 150],
                 
"outline": {
                   
"type": "esriSLS",
                   
"style": "esriSLSSolid",
                   
"color": [199, 55, 36, 255]
                 
}
               
},
               
"attributes": {
                 
"NAME": "National City",
                 
"BUILDING_AREA": 5000.5,
                 
"SITE_AREA": 10000.25,
                 
"FRONTAGE": 800,
                 
"PARKING": 300,
                 
"BUILDING_DATE": new Date().getTime(),
                 
"url": "https://upload.wikimedia.org/wikipedia/commons/thumb/a/ac/USA_CA_NationalCity_Westfield_002_2013.jpg/1280px-USA_CA_NationalCity_Westfield_002_2013.jpg",
                 
"url2": "https://upload.wikimedia.org/wikipedia/commons/7/7b/USA_CA_NationalCity_Center_002_2013_-_Mile_of_Cars.jpg"
               
}
             
}));

              graphicsLayer
.add(new Graphic({
               
"geometry": {
                 
"rings": [
                   
[
                     
[-13035942.366951615, 3848982.2034355192],
                     
[-13033935.894959131, 3849784.7922325125],
                     
[-13032636.465478284, 3850033.212574439],
                     
[-13031891.204452505, 3849039.531206733],
                     
[-13031069.506398441, 3848561.799779951],
                     
[-13030515.337943373, 3847663.6646976015],
                     
[-13029846.51394588, 3847166.8240137487],
                     
[-13029235.017719598, 3846096.7056177575],
                     
[-13034432.735642985, 3844395.9817384146],
                     
[-13035942.366951615, 3848982.2034355192]
                   
]
                 
],
                 
"spatialReference": {
                   
"wkid": 102100
                 
}
               
},
               
"symbol": {
                 
"type": "esriSFS",
                 
"style": "esriSFSSolid",
                 
"color": [55, 199, 36, 150],
                 
"outline": {
                   
"type": "esriSLS",
                   
"style": "esriSLSSolid",
                   
"color": [55, 199, 36, 255]
                 
}
               
},
               
"attributes": {
                 
"NAME": "Chula Vista",
                 
"BUILDING_AREA": 4000.5,
                 
"SITE_AREA": 8000.25,
                 
"FRONTAGE": 500,
                 
"PARKING": 200,
                 
"BUILDING_DATE": new Date().getTime(),
                 
"url": "https://upload.wikimedia.org/wikipedia/commons/1/12/ChulaVista_Bayfront.jpg"
               
}
             
}));

              graphicsLayer
.add(new Graphic({
               
"geometry": {
                 
"rings": [
                   
[
                     
[-13043772.385036565, 3859559.177224467],
                     
[-13041727.69452994, 3862272.691728587],
                     
[-13040542.92059152, 3862865.0786977964],
                     
[-13038230.700485898, 3862845.969440725],
                     
[-13037198.80060405, 3860648.404877529],
                     
[-13036778.396948481, 3859750.2697951794],
                     
[-13035803.824837847, 3858966.7902552574],
                     
[-13035803.824837847, 3857304.284890057],
                     
[-13034905.689755498, 3856119.5109516387],
                     
[-13034829.252727212, 3854093.929702084],
                     
[-13037542.767231332, 3853100.248334378],
                     
[-13040275.390992522, 3854437.896329367],
                     
[-13043523.96469464, 3856883.8812344894],
                     
[-13043772.385036565, 3859559.177224467]
                   
]
                 
],
                 
"spatialReference": {
                   
"wkid": 102100
                 
}
               
},
               
"symbol": {
                 
"type": "esriSFS",
                 
"style": "esriSFSSolid",
                 
"color": [36, 55, 199, 150],
                 
"outline": {
                   
"type": "esriSLS",
                   
"style": "esriSLSSolid",
                   
"color": [36, 55, 199, 255]
                 
}
               
},
               
"attributes": {
                 
"NAME": "San Diego",
                 
"BUILDING_AREA": 7000.5,
                 
"SITE_AREA": 12000.25,
                 
"FRONTAGE": 900,
                 
"PARKING": 350,
                 
"BUILDING_DATE": new Date().getTime(),
                 
"url": "https://upload.wikimedia.org/wikipedia/commons/thumb/b/be/Harbor_Drive%2C_San_Diego.jpg/1920px-Harbor_Drive%2C_San_Diego.jpg"
               
}
             
}));

              graphicsLayer
.add(new Graphic({
               
"geometry": {
                 
"rings": [
                   
[
                     
[-13044020.805378487, 3859387.193910824],
                     
[-13043944.368350202, 3858890.353226971],
                     
[-13043753.27577949, 3856826.553463274],
                     
[-13037829.406087395, 3853004.7020490207],
                     
[-13034619.050899422, 3844290.880824522],
                     
[-13038096.935686393, 3842227.0810608254],
                     
[-13039205.272596527, 3843717.603112384],
                     
[-13039778.550308665, 3846163.5880175065],
                     
[-13042148.098185502, 3850864.4652570384],
                     
[-13044364.772005768, 3852890.046506593],
                     
[-13049256.741816014, 3853654.4167894437],
                     
[-13049256.741816014, 3855756.435067283],
                     
[-13044020.805378487, 3859387.193910824]
                   
]
                 
],
                 
"spatialReference": {
                   
"wkid": 102100
                 
}
               
},
               
"symbol": {
                 
"type": "esriSFS",
                 
"style": "esriSFSSolid",
                 
"color": [199, 55, 199, 150],
                 
"outline": {
                   
"type": "esriSLS",
                   
"style": "esriSLSSolid",
                   
"color": [199, 55, 199, 255]
                 
}
               
},
               
"attributes": {
                 
"NAME": "San Diego Bay",
                 
"BUILDING_AREA": 6500.5,
                 
"SITE_AREA": 11300.25,
                 
"FRONTAGE": 820,
                 
"PARKING": 290,
                 
"BUILDING_DATE": new Date().getTime(),
                 
"url": "https://upload.wikimedia.org/wikipedia/commons/thumb/2/27/OverCoronadoSanDiegoAug07.jpg/800px-OverCoronadoSanDiegoAug07.jpg"
               
}
             
}));

             
// add a listener to the layer
             
var player, playerDiv;

             
var infoWindow = new InfoWindowLite(null, domConstruct.create("div", null, null, map.root));
              infoWindow
.startup();
              map
.setInfoWindow(infoWindow);
              aspect
.after(infoWindow, "onHide", function () {
                player
&& player.destroy();
                domConstruct
.destroy(playerDiv);
             
});
              domClass
.add(infoWindow.domNode, "playerInfoWindow");

             
var highlightedGraphics = [];

             
function runPlayerForSelectedGraphics(graphics, mapPoint) {

               
var isFullScreen = isMobile || viewModeSelector.get("value") === PlayerViewModes.FULL_PAGES;

               
//--------------------------------------------------------------------------
               
//
               
//  Highlight
               
//
               
//--------------------------------------------------------------------------

                highlightedGraphics
.forEach(function (g) {
                  g
.setSymbol(g.__originalSymbol);
                 
delete g.__originalSymbol;
               
});
                highlightedGraphics
.length = 0;

               
if (!isFullScreen)
                  graphics
.forEach(function (g) {
                    g
.__originalSymbol = g.symbol;
                    highlightedGraphics
.push(g);
                   
HighlightedSymbolGenerator.getHighlightSymbol({
                      graphic
: g,
                      outlineOnly
: true
                   
}).then(function (hInfo) {
                      hInfo
.symbol && g.setSymbol(hInfo.symbol);
                   
});
                 
});

               
//--------------------------------------------------------------------------
               
//
               
//  Report Player
               
//
               
//--------------------------------------------------------------------------

                infoWindow
.hide();
                player
&& player.destroy();
                domConstruct
.destroy(playerDiv);

               
// configure playerDiv for the current view and resize modes
                playerDiv
= domConstruct.create("div", null, document.body);

               
if (isFullScreen)
                  domClass
.add(playerDiv, "playerDivFullScreen");
               
else {
                  domClass
.add(playerDiv, "playerDivInfoWindow");
                  map
.infoWindow.show(mapPoint);
                  map
.infoWindow.setContent(playerDiv);
               
}

                player
= new ReportPlayer({
                  viewMode
: viewModeSelector.get("value"),
                  resizeMode
: isFullScreen ? PlayerResizeModes.FIT_WINDOW : PlayerResizeModes.AUTO,
                  showCloseButton
: isFullScreen,
                  showToolbarInPopup
: !isFullScreen,
                  showAreaTitle
: true,
                  showToFullScreenAnimation
: isFullScreen,
                  onClose
: function () {
                    player
.destroy();
                    domConstruct
.destroy(playerDiv);
                 
}
               
}).placeAt(playerDiv);

               
function playerReport(reportID) {
                  player
.playReport({
                    portalUrl
: DEFAULTS.portalUrl,
                    countryID
: DEFAULTS.countryID,
                    reportID
: reportID,
                    analysisAreas
: graphics.map(function (g) {
                     
return {
                       
"name": g.attributes.NAME,
                       
"shortName": g.attributes.NAME,
                       
"feature": g
                     
};
                   
}),
                   
// for multi-feature reports like "Multi-ring Comparison"
                    combinedAreasInfo
: {
                      address
: graphics[0].attributes.NAME + " et al.",
                      description
: graphics.length + " polygon areas"
                   
},
                    attachmentsProvider
: {
                      supportsMultipleAreas
: true,
                      getAttributesForAreaAt
: function (areaIndex) {
                       
var attributes = graphics[areaIndex].attributes;
                       
return [{
                            name
: "BUILDING_AREA",
                            alias
: "Building area (sq. ft)",
                            type
: "esriFieldTypeDouble",
                            value
: attributes["BUILDING_AREA"]
                         
},
                         
{
                            name
: "SITE_AREA",
                            alias
: "Site area (sq. ft)",
                            type
: "esriFieldTypeDouble",
                            value
: attributes["SITE_AREA"]
                         
},
                         
{
                            name
: "FRONTAGE",
                            alias
: "Frontage",
                            type
: "esriFieldTypeInteger",
                            value
: attributes["FRONTAGE"]
                         
},
                         
{
                            name
: "PARKING",
                            alias
: "Parking",
                            type
: "esriFieldTypeInteger",
                            value
: attributes["PARKING"]
                         
},
                         
{
                            name
: "BUILDING_DATE",
                            alias
: "Building date",
                            type
: "esriFieldTypeDate",
                            value
: attributes["BUILDING_DATE"]
                         
}
                       
];
                     
},
                      getNotesForAreaAt
: function (areaIndex) {
                       
var attributes = graphics[areaIndex].attributes;
                       
return [{
                          text
: "This is a note example for area " + attributes.NAME
                       
}];
                     
},
                      getAttachmentsForAreaAt
: function (areaIndex) {
                       
var attributes = graphics[areaIndex].attributes;
                       
var urls = [];
                        attributes
.url && urls.push(attributes.url);
                        attributes
.url2 && urls.push(attributes.url2);
                       
return urls.map(function (url) {
                         
return {
                            description
: "Image for " + attributes.NAME,
                            getThumbnail
: function () {
                             
return url;
                           
},
                            getAttachmentUrl
: function () {
                             
return url;
                           
}
                         
};
                       
});
                     
}
                   
}
                 
}).then(function () {
                   
// refresh the position of the info window
                   
!isFullScreen && infoWindow.resize(infoWindow.width, infoWindow.height);
                 
});
               
};

               
// limit the size of the info window
               
if (!isFullScreen) {
                  player
.setMaxWidth(700);
                  player
.setMaxHeight(500);
               
} else {
                 
// add a select to choose infographics right from the player
                 
var inPlayerSelect = new OnDemandSelect({
                   
"class": "esriGEOnDemandSelectWhite esriGEOnDemandSelectNoBackground",
                    listClass
: "esriGEOnDemandSelectUnlimitedTallList esriGEOnDemandSelectSpacedOut",
                    value
: templateSelector.get("value"),
                    options
: StandardGraphicReportTemplates.getListOptions("US"),
                    onChange
: function (event) {
                      templateSelector
.set("value", event.value); // sync with the main selector
                      playerReport
(event.value);
                   
}
                 
});
                  player
.playerToolbar.addInfographicsSelect(inPlayerSelect);
               
}

                playerReport
(templateSelector.get("value"));
             
};

              graphicsLayer
.on("click", function (event) {
                runPlayerForSelectedGraphics
([event.graphic], event.mapPoint);
             
});
           
});
         
});
     
});
 
</script>
</head>

<body class="claro">
 
<div id="topToolbarDiv" class="topToolbar">
   
<div id="topToolbarHelperText" class="topToolbarLabel"></div>
   
<div class="dijitInline" style="white-space:nowrap;">
     
<div class="dijitInline topToolbarLabel">Template:</div>
     
<div class="dijitInline topToolbarItem" id="templateSelectorDiv"></div>
   
</div>
   
<div class="dijitInline" style="white-space:nowrap;">
     
<div class="dijitInline topToolbarLabel">View infographic in:</div>
     
<div class="dijitInline topToolbarItem" id="viewModeSelectorDiv"></div>
   
</div>
 
</div>
 
<div id="mapDiv"></div>
</body>

</html>
 
         
Show Modal