Hide Table of Contents
View Add a topographic map with graphics sample in sandbox
Add a topographic map with graphics

Description

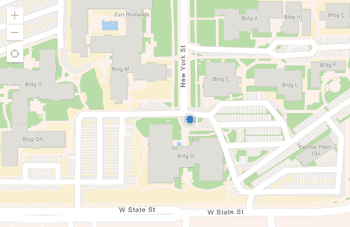
This sample shows how to add custom graphics on top of a basemap. The sample uses the World Topographic service as the basemap. This is an ArcGIS Online cached map service from the ArcGIS.com site which includes administrative features, physiographic features, parks, buildings, land cover, shaded relief imagery and much more. You can browse the ArcGIS Online site for additional online basemap and reference map services or publish your own geographic data as a service using ArcGIS Server.

Custom graphics are added on top of the basemap to show the location of a popular running route in Redlands, CA along with information about available facilites (water, phone, restroom) found along the route. Here's a snippet of code from the application that adds a new point graphic to the map. The graphic is created at the specified x,y location and contains information about the facilities located at that spot.

var infoSymbol = new esri.symbol.PictureMarkerSymbol("../images/info.png",30,30);
var infoTemplate = new esri.InfoTemplate("${Name}", "Restroom: ${Facilities}<br />
Phone: ${Phone}<br />Water: ${Water}"
);
var park1 = new esri.Graphic({"geometry":{"x":-13043577.827992536,"y":4034040.568968247,
"spatialReference":{"wkid":102100}},"attributes":{"Name":"Prospect Park",
"Facilities":"Yes","Water":"Yes","Phone":"No"}});
park1
.setSymbol(infoSymbol);
park1
.setInfoTemplate(infoTemplate);
map
.graphics.add(park1);

NOTE: This sample application uses the following icons from Wikimedia Commons:

Code

<!DOCTYPE html>
<html>
  <head>
    <meta http-equiv="Content-Type" content="text/html; charset=utf-8">
    
    <meta name="viewport" content="initial-scale=1, maximum-scale=1,user-scalable=no">
    <title> Topographic Map with graphics</title>
    <link rel="stylesheet" href="https://js.arcgis.com/3.46/dijit/themes/claro/claro.css">
    <link rel="stylesheet" href="https://js.arcgis.com/3.46/esri/css/esri.css">
    <style>
      html, body { height: 100%; width: 100%; margin: 0; padding: 0; }
      map{
        padding:0;
      }
    </style>

    <script>var dojoConfig = {parseOnLoad: true};</script>
    <script src="https://js.arcgis.com/3.46/"></script>
    <script>
      dojo.require("dijit.layout.BorderContainer");
      dojo.require("dijit.layout.ContentPane");
      dojo.require("esri.map");

      var map;

      function init() {
        map = new esri.Map("map",{
          basemap: "topo-vector",
          center: [-117.17, 34.035],
          zoom: 16
        });

        dojo.connect(map, "onLoad", function(map) {
          //Add running route graphics once the map loads
          drawRoute();
        });

      }
      function drawRoute() {
        var inputJson = {"paths":[[[-13043348,4034155],[-13043274,4034040]],[[-13043274,4034040],[-13043226,4034010]],[[-13043226,4034010],[-13043201,4034010]],[[-13043201,4034010],[-13043193,4033972]],[[-13043193,4033972],[-13043248,4033928]],[[-13043248,4033928],[-13043275,4033909]],[[-13043275,4033909],[-13043284,4033890]],[[-13043284,4033890],[-13043319,4033900]],[[-13043319,4033900],[-13043341,4033886]],[[-13043341,4033886],[-13043349,4033870]],[[-13043349,4033870],[-13043341,4033808]],[[-13043341,4033808],[-13043171,4033551]],[[-13043171,4033551],[-13043097,4033605]],[[-13043097,4033605],[-13043097,4033357]],[[-13043097,4033357],[-13042661,4033348]],[[-13042661,4033348],[-13042660,4033162]],[[-13042660,4033162],[-13042661,4032943]],[[-13042661,4032943],[-13042501,4032943]],[[-13042501,4032943],[-13042498,4032620]],[[-13042498,4032620],[-13042455,4032616]],[[-13042455,4032616],[-13042446,4032376]],[[-13042446,4032376],[-13042419,4032299]],[[-13042419,4032299],[-13042314,4032243]],[[-13042314,4032243],[-13042250,4032188]],[[-13042250,4032188],[-13042237,4032151]],[[-13042237,4032151],[-13042243,4032109]],[[-13042243,4032109],[-13042243,4032056]],[[-13042243,4032056],[-13042240,4032025]],[[-13042240,4032025],[-13042254,4032012]],[[-13042254,4032012],[-13042284,4032064]],[[-13042284,4032064],[-13042315,4032095]],[[-13042315,4032095],[-13042674,4032187]],[[-13042674,4032187],[-13042704,4032195]],[[-13042704,4032195],[-13042739,4032257]],[[-13042739,4032257],[-13042765,4032267]],[[-13042765,4032267],[-13042834,4032275]],[[-13042834,4032275],[-13042868,4032295]],[[-13042868,4032295],[-13042882,4032357]],[[-13042882,4032357],[-13042883,4032422]],[[-13042883,4032422],[-13042926,4032452]],[[-13042926,4032452],[-13042992,4032527]],[[-13042992,4032527],[-13043059,4032609]],[[-13043059,4032609],[-13043116,4032593]],[[-13043116,4032593],[-13043278,4032553]],[[-13043278,4032553],[-13043324,4032547]],[[-13043324,4032547],[-13043488,4032597]],[[-13043488,4032597],[-13043561,4032603]],[[-13043561,4032603],[-13043773,4032808]],[[-13043773,4032808],[-13043889,4032917]],[[-13043889,4032917],[-13043963,4032871]],[[-13043963,4032871],[-13044030,4032829]],[[-13044030,4032829],[-13044206,4032840]],[[-13044206,4032840],[-13044286,4032865]],[[-13044286,4032865],[-13044391,4032910]],[[-13044391,4032910],[-13044509,4032958]],[[-13044509,4032958],[-13044658,4033187]],[[-13044658,4033187],[-13044265,4033451]],[[-13044265,4033451],[-13044065,4033580]],[[-13044065,4033580],[-13043994,4033655]],[[-13043994,4033655],[-13043946,4033713]],[[-13043946,4033713],[-13044097,4033954]],[[-13044097,4033954],[-13043891,4034095]],[[-13043891,4034095],[-13043482,4034361]],[[-13043482,4034361],[-13043381,4034203]]],"spatialReference":{"wkid":102100}};

        //setup the symbology for the graphics (route line, start and stop points and water location)
        var polylineSymbol = new esri.symbol.SimpleLineSymbol(esri.symbol.SimpleLineSymbol.STYLE_SOLID, new dojo.Color([102,0,51]), 4);
        var startSymbol = new esri.symbol.PictureMarkerSymbol("images/play.png",25,25);
        var stopSymbol = new esri.symbol.PictureMarkerSymbol("images/stop.png",25,25);
        var infoSymbol = new esri.symbol.PictureMarkerSymbol("images/info.png",30,30);


        //create a graphic for the running route using the input json
        var runningRoute = new esri.geometry.Polyline(inputJson);
        map.graphics.add(new esri.Graphic(runningRoute,polylineSymbol));

        //add a graphic for the running route start and stop locations
        var startPoint = new esri.geometry.Point( {"x": -13043348, "y": 4034155," spatialReference": {" wkid": 102100 } });
        var stopPoint = new esri.geometry.Point( {"x": -13043381, "y": 4034203," spatialReference": {" wkid": 102100 } });

        map.graphics.add(new esri.Graphic(startPoint,startSymbol));
        map.graphics.add(new esri.Graphic(stopPoint,stopSymbol));

        //add points of interest (water, restroom etc) - add info template describing facilities.
        var infoTemplate = new esri.InfoTemplate("${Name}", "Restroom: ${Facilities}<br />Phone: ${Phone}<br />Water: ${Water}");
        var park1 = new esri.Graphic({"geometry":{"x":-13043577,"y":4034040,
          "spatialReference":{"wkid":102100}},"attributes":{"Name":"Prospect Park",
          "Facilities":"Yes","Water":"Yes","Phone":"No"}});
        park1.setSymbol(infoSymbol);
        park1.setInfoTemplate(infoTemplate);

        map.graphics.add(park1);

        var park2 =  new esri.Graphic({"geometry":{"x":-13042885,"y":4033247,
          "spatialReference":{"wkid":102100}},"attributes":{"Name":"Kimberly Elementary",
          "Facilities":"No","Water":"Yes","Phone":"No"}});
        park2.setSymbol(infoSymbol);
        park2.setInfoTemplate(infoTemplate);
        map.graphics.add(park2);
        map.infoWindow.resize(110, 100);
      }

      dojo.ready(init);
    </script>
  </head>

  <body class="claro">
    <div data-dojo-type="dijit.layout.BorderContainer"
         data-dojo-props="design:'headline', gutters:false"
         style="width: 100%; height: 100%; margin: 0;">

      <div id="map"
           data-dojo-type="dijit.layout.ContentPane"
           data-dojo-props="region:'center'">
      </div>

    </div>
  </body>

</html>
 
          
Show Modal