This sample demonstrates how to generate a predominance visualization based on a set of competing numeric fields in a FeatureLayer. This is accomplished with the createRenderer() method in the predominance renderer creator helper object.
Visualizing predominance involves coloring a layer’s features based on which attribute among a set of competing numeric attributes wins or beats the others in total count. Common applications of this include visualizing election results, survey results, and demographic majorities.
This sample visualizes block groups in Boise, Idaho based on the predominant decade in which homes were constructed. If you glance at the service metadata for the layer, you’ll see a list of ten numeric fields containing a count of housing units based on the decade they were constructed.

These are competing fields because a housing unit cannot finish construction in more than one decade.
To illustrate how predominance works, we expose all the competing fields to the user in a calcite-list element.
<calcite-list id="field-list" label="Home construction decades" scale="s" selection-mode="multiple"> <calcite-list-item value="ACSBLT1939" label="Before 1940" selected></calcite-list-item> <calcite-list-item value="ACSBLT1940" label="1940-1949" selected></calcite-list-item> <calcite-list-item value="ACSBLT1950" label="1950-1959" selected></calcite-list-item> <calcite-list-item value="ACSBLT1960" label="1960-1969" selected></calcite-list-item> <calcite-list-item value="ACSBLT1970" label="1970-1979" selected></calcite-list-item> <calcite-list-item value="ACSBLT1980" label="1980-1989" selected></calcite-list-item> <calcite-list-item value="ACSBLT1990" label="1990-1999" selected></calcite-list-item> <calcite-list-item value="ACSBLT2000" label="2000-2009" selected></calcite-list-item> <calcite-list-item value="ACSBLT2010" label="2010-2013" selected></calcite-list-item> <calcite-list-item value="ACSBLT2014" label="After 2013" selected></calcite-list-item> </calcite-list>Then add a function that generates the predominance renderer each time the user adds or removes a field from the visualization.
/** * Generates a new predominance renderer based on the selected fields in the * list box. Returns a promise that resolves to an object containing the renderer. */ const createPredominanceRenderer = () => { const fields = fieldList.selectedItems.map(({ value, label }) => { return { name: value, label, }; });
if (!fields.length) { return Promise.resolve(null); }
const params = { view: viewElement.view, layer: layer, fields: fields, includeSizeVariable: includeSizeCheckbox.checked, includeOpacityVariable: includeOpacityCheckbox.checked, legendOptions: { title: "Most common decade in which homes were built", }, sortBy: "value", };
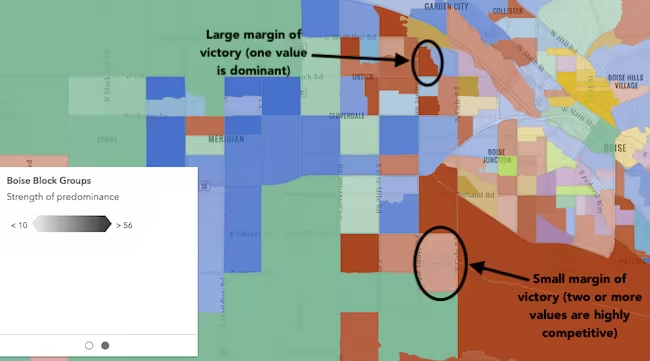
return predominanceRendererCreator.createRenderer(params); };You can optionally include a size and/or an opacity visual variable to add another dimension to the visualization. When the opacity variable is enabled, high opacity features indicate highly predominant values. Features where the predominant value beats others by a small margin will be assigned a low opacity, indicating that while the feature has a winning value, it doesn’t win by much.
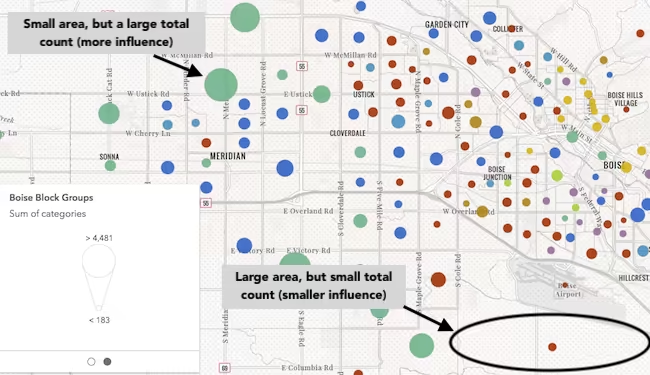
When the size variable is enabled, features will be assigned a size based on the sum of all competing values. Features with small total counts will be sized with small icons or lines depending on the geometry type of the layer, and features with large total counts will be sized with large icons or lines. Enabling this option is good for visualizing how influential a particular feature is compared to the dataset as a whole. It removes bias introduced by features with large geographic areas, but relatively small data values.
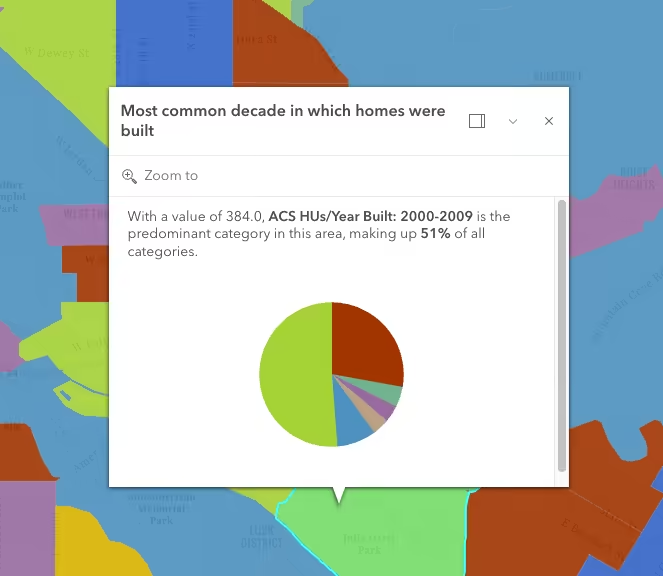
The esri/smartMapping/popup/templates module allows you to generate default popup templates that only contain information relevant to the layer’s renderer.
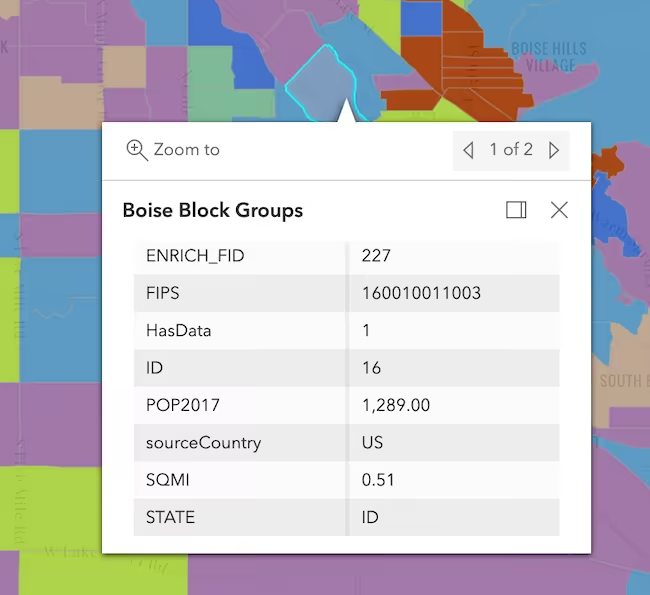
// Creates a popup template only containing information related to the renderer const createPopupTemplate = async (layer) => { const response = await popupTemplateCreator.getTemplates({ layer: layer }); const chartTemplate = response.secondaryTemplates.find( (template) => template.name === "predominant-category-chart", ); layer.popupTemplate = chartTemplate.value; };This provides a better default popup template than the traditional approach of providing a long table of unformatted values.
| Suggested default template based on renderer | Traditional default |
|---|---|
 |  |
A word of caution
Keep in mind that generating renderers should be avoided in most applications because of the performance cost affecting the end user. As stated in the Smart Mapping guide topic, the Smart Mapping APIs were designed for two types of applications: data exploration apps and visualization authoring apps similar to ArcGIS Online. In all other cases, renderers should be saved to the layer or manually created using any of the renderer classes.
Additional visualization samples and resources
- Create a custom visualization using an Arcade expression
- Query statistics client-side
- ArcGIS Blog: Creating a predominance visualization with Arcade
- ArcGIS Blog: Map Multiple Attributes at Once using Predominance