This sample demonstrates how to create a reference size visualization (i.e. also known as “Wurman Dots”) in a gridded dataset. The reference size theme was inspired by the 1967 book Urban Atlas: 20 American Cities by Richard Saul Wurman. This theme visualizes numeric data, such as total population, using proportional size with an outer ring that functions as a reference line representing the maximum data value (or other bounded value).
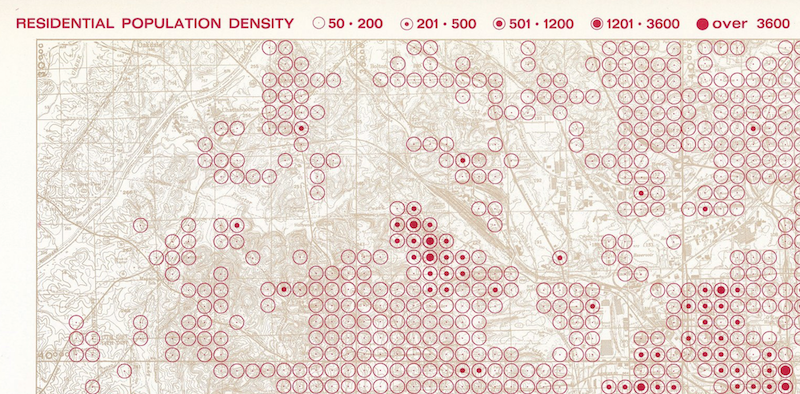
This is a good style for visualizing ratios and percentages. Higher percentages are represented by symbols that are more filled-in whereas lower percentages show circles that are more empty. Areas with no value at all are not symbolized. It works best for gridded datasets where geometries don’t overlap, such as styles for binning, hexbin layers, or any other layer created with data aggregated to tessellated shapes. While this style lends itself to visualizing a single variable, such as population density, it also works well in multivariate visualizations, such as population density and income.
In this sample, we fill the circles based on the percentage of land covered by forest (NLCD). We use a color visual variable to represent total population. High population areas are orange, and areas with little or no population are green. Heavily forested areas are represented by circles that are filled in.
We achieve this visualization by calling the createContinuousRenderer() method from the size renderer creator smart mapping module and setting the theme to reference-size.
const sizeParams = { layer, view: viewElement.view, field: "NLCDfrstPt", theme: "reference-size", };
sizeRendererCreator .createContinuousRenderer(sizeParams) .then(({ renderer }) => { renderer.visualVariables = [ { type: "color", field: "POP2010", legendOptions: { title: "Population", }, stops: [ { value: 0, color: [57, 74, 53], }, { value: 15000, color: [94, 120, 89], }, { value: 30000, color: [235, 227, 215], }, { value: 90000, color: [199, 143, 70], }, { value: 150000, color: [201, 114, 0], }, ], }, ]; layer.renderer = renderer; layer.visible = true; }) .catch((error) => { console.log("there was an error: ", error); });This method generates a renderer containing a CIMSymbol with two symbol layers - one representing the outer circle (total area), the other represents the inner circle (or percent of forested area).