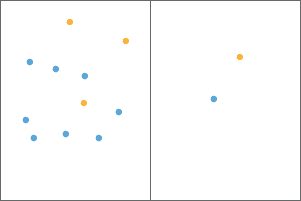
ST_Aggr_MeanCenter operates on a grouped DataFrame and returns the weighted aggregated centroid (mean center) of geometries in each group. You can optionally specify a numeric weight column which is used to weight locations according to their relative importance. The default is unweighted. You can group your DataFrame using DataFrame.groupBy() or with a GROUP BY clause in a SQL statement.
| Function | Syntax |
|---|---|
| Python | aggr |
| SQL | ST |
| Scala | aggr |
For more details, go to the GeoAnalytics for Microsoft Fabric API reference for aggr_mean_center.
Examples
from geoanalytics_fabric.sql import functions as ST, Polygon
data = [
(1, Polygon([[[5,5],[12,5],[12,10],[5,10],[5,5]]])),
(1, Polygon([[[10,8],[14,8],[14,15],[10,15],[10,8]]])),
(2, Polygon([[[6,8],[20,8],[20,20],[6,20],[6,8]]]))
]
df = spark.createDataFrame(data, ["id", "polygon"])
df.groupBy("id")\
.agg(ST.aggr_mean_center("polygon").alias("aggr_meancenter"))\
.show(truncate=False)Result
+---+-------------------+
|id |aggr_meancenter |
+---+-------------------+
|1 |{"x":10.25,"y":9.5}|
|2 |{"x":13,"y":14} |
+---+-------------------+Version table
| Release | Notes |
|---|---|
1.0.0-beta | Python, SQL, and Scala functions introduced |