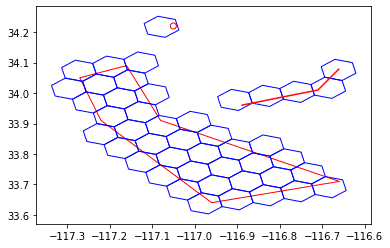
ST_H3Bins takes a geometry column and a numeric H3 resolution and returns an array column. The result array contains h3 bins that cover the spatial extent of each record in the input column. H3 is a hierarchical geospatial indexing system that partitions the world sphere into hexagonal and pentagonal tiles. H3 supports 16 resolutions ranging from 0 to 15, where 0 results in the largest bins and 15 the smallest. For detailed information on the number of bins and average bin areas at every resolution, please refer to the H3 Tables of Cell Statistics Across Resolutions.
You can optionally specify a numeric value for padding, which conceptually applies a buffer of the specified distance to the input geometry before creating the H3 bins. The padding is in the units of meters. Use ST_BinGeometry to obtain the geometry of each result bin.
ST_H3Bins requires the spatial reference to be set to World Geodetic System 1984 (EPSG:4326). If the input geometry is in a different spatial reference, the function automatically transforms the geometry into World Geodetic System 1984. To learn more about spatial references, see Coordinate systems and transformations.
| Function | Syntax |
|---|---|
| Python | h3 |
| SQL | ST |
| Scala | h3 |
For more details, go to the GeoAnalytics for Microsoft Fabric API reference for h3_bins.
Python and SQL Example
from geoanalytics_fabric.sql import functions as ST
from pyspark.sql import functions as F
data = [
("POINT (-117.05 34.22)",),
("LINESTRING (-116.89 33.96, -116.71 34.01, -116.66 34.08)", ),
("POLYGON ((-117.27 34.05, -117.22 33.91, -116.96 33.64, -116.66 33.71, -117.08 33.91, -117.16 34.09, -117.27 34.05))", )
]
df = spark.createDataFrame(data, ["wkt"]) \
.withColumn("geometry", ST.geom_from_text("wkt", srid=4326))
bins = df.select(ST.h3_bins("geometry", 6).alias("h3_bins"))
bin_geometries = bins.select(F.explode("h3_bins").alias("bins")).select(ST.bin_geometry("bins"))
ax = df.st.plot("geometry", facecolor="none", edgecolor="red")
bin_geometries.st.plot(ax=ax, facecolor="none", edgecolor="blue")
Scala Example
import com.esri.geoanalytics.sql.{functions => ST}
import org.apache.spark.sql.{functions => F}
case class GeometryRow(wkt: String)
val data = Seq(GeometryRow("POINT (-117.05 34.22)"),
GeometryRow("LINESTRING (-116.89 33.96, -116.71 34.01, -116.66 34.08)"),
GeometryRow("POLYGON ((-117.27 34.05, -117.22 33.91, -116.96 33.64, -116.66 33.71, -117.08 33.91, -117.16 34.09, -117.27 34.05))"))
val df = spark.createDataFrame(data)
.withColumn("geometry", ST.geomFromText($"wkt", F.lit(4326)))
.select(ST.h3Bins($"geometry", 6, 0).alias("h3_bins"))
df.show()+--------------------+
| h3_bins|
+--------------------+
|[bin#604214655010...|
|[bin#604214647762...|
|[bin#604214676619...|
+--------------------+Version table
| Release | Notes |
|---|---|
1.0.0-beta | Python, SQL, and Scala functions introduced |