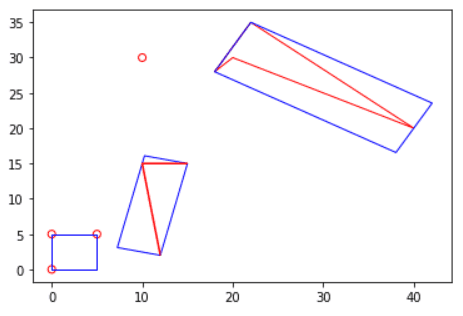
ST_MinBoundingBox takes a geometry column and returns a polygon column. The output column contains a polygon for each geometry in the input column. The polygon is the smallest rectangle of arbitrary alignment that encompasses the input geometry. You can optionally provide a boolean value that determines how the rectangle will be created. There are two options:
True: Creates a rectangle with the minimum possible area. This is the default.False: Creates a rectangle with the minimum possible width.
For point geometries, this function will return a degenerate polygon at the location of the point.
To find the minimum bounding box that aligns to the x and y axis, use ST_Envelope.
| Function | Syntax |
|---|---|
| Python | min |
| SQL | ST |
| Scala | min |
For more details, go to the GeoAnalytics for Microsoft Fabric API reference for min_bounding_box.
Python and SQL Examples
from geoanalytics_fabric.sql import functions as ST
data = [
("POINT (10 30)",),
("MULTIPOINT (0 0, 5 5, 0 5)", ),
("LINESTRING (15 15, 10 15, 12 2)", ),
("POLYGON ((20 30, 18 28, 22 35, 40 20))", )
]
df = spark.createDataFrame(data, ["wkt"])\
.select(ST.geom_from_text("wkt").alias("geometry"))
df = df.withColumn("min_bounding_box", ST.min_bounding_box("geometry"))
ax = df.st.plot("geometry", facecolor="none", edgecolor="red")
df.st.plot("min_bounding_box", ax=ax, facecolor="none", edgecolor="blue")
Scala Example
import com.esri.geoanalytics.sql.{functions => ST}
case class GeometryRow(wkt: String)
val data = Seq(GeometryRow("POINT (10 30)"),
GeometryRow("MULTIPOINT (0 0, 5 5, 0 5)"),
GeometryRow("LINESTRING (15 15, 10 15, 12 2)"),
GeometryRow("POLYGON ((20 30, 18 28, 22 35, 40 20))"))
val df = spark.createDataFrame(data)
.select(ST.geomFromText($"wkt").alias("geometry"))
.withColumn("min_bounding_box", ST.minBoundingBox($"geometry"))
df.select("min_bounding_box").show(truncate = false)+--------------------------------------------------------------------------------------------------------------------------------------------------+
|min_bounding_box |
+--------------------------------------------------------------------------------------------------------------------------------------------------+
|{"rings":[[[10,30],[10,30],[10,30],[10,30]]]} |
|{"rings":[[[3.061616997868383e-16,5],[5,5],[5,0],[0,0],[3.061616997868383e-16,5]]]} |
|{"rings":[[[11.999999999999998,2],[7.2528089887640395,3.0955056179775298],[10.252808988764045,16.09550561797753],[15,15],[11.999999999999998,2]]]}|
|{"rings":[[[22,35],[42.030769230769224,23.553846153846163],[38.03076923076923,16.553846153846152],[18,28],[22,35]]]} |
+--------------------------------------------------------------------------------------------------------------------------------------------------+Version table
| Release | Notes |
|---|---|
1.0.0-beta | Python, SQL, and Scala functions introduced |