Change a line graphic’s color, width and style.
Use case
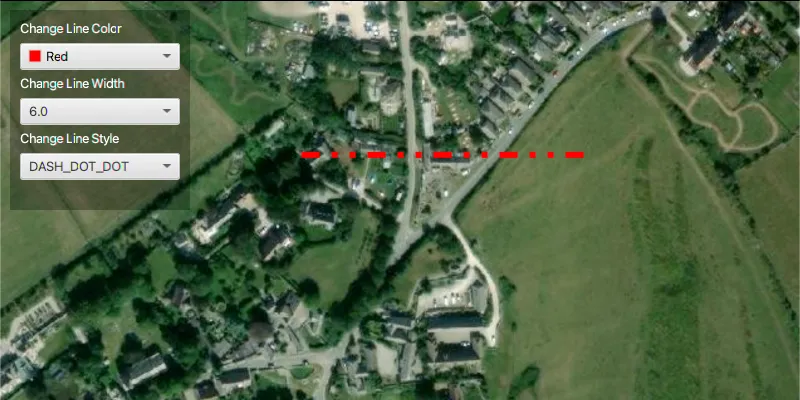
Customize the appearance of a line with a color, width and style scheme suitable for the data. For example, a red line with a dashed style could represent a geological fault mapped on a geological map.
How to use the sample
Use the drop down menus in the control panel to change the line color, width and style.
How it works
- Create a
Polylineusing aPointCollectionto define its geometry. - Create a
SimpleLineSymbol(SimpleLineSymbol.Style, color, width). - Set the color, width and style of the simple line symbol object with:
setColor();setWidth();setStyle();
- Create a
Graphicpassing in the polyline and simple line symbol as parameters. - Add the graphic to the graphics overlay with
graphicsOverlay.getGraphics().add(new Graphic(line, simpleLineSymbol)).
Relevant API
- Graphic
- GraphicsOverlay
- PointCollection
- Polyline
- SimpleLineSymbol
Tags
graphic, line, symbol
Sample code
SimpleLineSymbolSample.java
/* * Copyright 2017 Esri. * * Licensed under the Apache License, Version 2.0 (the "License"); you may not * use this file except in compliance with the License. You may obtain a copy of * the License at * * http://www.apache.org/licenses/LICENSE-2.0 * * Unless required by applicable law or agreed to in writing, software * distributed under the License is distributed on an "AS IS" BASIS, WITHOUT * WARRANTIES OR CONDITIONS OF ANY KIND, either express or implied. See the * License for the specific language governing permissions and limitations under * the License. */
package com.esri.samples.simple_line_symbol;
import com.esri.arcgisruntime.ArcGISRuntimeEnvironment;import com.esri.arcgisruntime.geometry.PointCollection;import com.esri.arcgisruntime.geometry.Polyline;import com.esri.arcgisruntime.geometry.SpatialReferences;import com.esri.arcgisruntime.mapping.ArcGISMap;import com.esri.arcgisruntime.mapping.BasemapStyle;import com.esri.arcgisruntime.mapping.Viewpoint;import com.esri.arcgisruntime.mapping.view.Graphic;import com.esri.arcgisruntime.mapping.view.GraphicsOverlay;import com.esri.arcgisruntime.mapping.view.MapView;import com.esri.arcgisruntime.symbology.SimpleLineSymbol;import com.esri.arcgisruntime.symbology.SimpleLineSymbol.Style;import javafx.application.Application;import javafx.geometry.Insets;import javafx.geometry.Pos;import javafx.scene.Scene;import javafx.scene.control.ColorPicker;import javafx.scene.control.ComboBox;import javafx.scene.control.Label;import javafx.scene.layout.Background;import javafx.scene.layout.BackgroundFill;import javafx.scene.layout.CornerRadii;import javafx.scene.layout.StackPane;import javafx.scene.layout.VBox;import javafx.scene.paint.Color;import javafx.scene.paint.Paint;import javafx.stage.Stage;
public class SimpleLineSymbolSample extends Application {
  private MapView mapView;
  @Override  public void start(Stage stage) {
    try {      // create stack pane and application scene      StackPane stackPane = new StackPane();      Scene scene = new Scene(stackPane);      scene.getStylesheets().add(getClass().getResource("/simple_line_symbol/style.css").toExternalForm());
      // set title, size, and add scene to stage      stage.setTitle("Simple Line Symbol Sample");      stage.setWidth(800);      stage.setHeight(700);      stage.setScene(scene);      stage.show();
      // authentication with an API key or named user is required to access basemaps and other location services      String yourAPIKey = System.getProperty("apiKey");      ArcGISRuntimeEnvironment.setApiKey(yourAPIKey);
      // create a control panel      var controlsVBox = new VBox(6);      controlsVBox.setBackground(new Background(new BackgroundFill(Paint.valueOf("rgba(0,0,0,0.3)"), CornerRadii.EMPTY,        Insets.EMPTY)));      controlsVBox.setPadding(new Insets(10.0));      controlsVBox.setMaxSize(180, 200);      controlsVBox.getStyleClass().add("panel-region");
      // create a line symbol      var lineSymbol = new SimpleLineSymbol(Style.SOLID, Color.RED, 3);
      // create a color picker that updates the line symbol's color property      var colorLabel = new Label("Change Line Color");      colorLabel.getStyleClass().add("panel-label");      var colorPicker = new ColorPicker();      colorPicker.setMaxWidth(Double.MAX_VALUE);      colorPicker.valueProperty().bindBidirectional(lineSymbol.colorProperty());
      // create a combobox that updates the line symbol's width      var widthLabel = new Label("Change Line Width");      widthLabel.getStyleClass().add("panel-label");      ComboBox<Float> widthBox = new ComboBox<>();      widthBox.getItems().addAll(1f, 3f, 6f);      widthBox.setMaxWidth(Double.MAX_VALUE);      widthBox.getSelectionModel().select(lineSymbol.getWidth());      widthBox.getSelectionModel().selectedItemProperty().addListener((obs, oldValue, newValue) ->        lineSymbol.setWidth(newValue));
      // create a combobox that updates the line symbol's style      var styleLabel = new Label("Change Line Style");      styleLabel.getStyleClass().add("panel-label");      ComboBox<Style> styleBox = new ComboBox<>();      styleBox.getItems().addAll(Style.DASH, Style.DASH_DOT, Style.DASH_DOT_DOT, Style.DOT, Style.SOLID, Style.NULL);      styleBox.setMaxWidth(Double.MAX_VALUE);      styleBox.getSelectionModel().select(lineSymbol.getStyle());      styleBox.getSelectionModel().selectedItemProperty().addListener((obs, oldValue, newValue) ->        lineSymbol.setStyle(newValue));
      // add controls to the control panel      controlsVBox.getChildren().addAll(colorLabel, colorPicker, widthLabel, widthBox, styleLabel, styleBox);
      // create a map with the standard imagery basemap style      final ArcGISMap map = new ArcGISMap(BasemapStyle.ARCGIS_IMAGERY_STANDARD);
      // create a map view and set the map to it      mapView = new MapView();      mapView.setMap(map);
      // set a viewpoint on the map view      mapView.setViewpoint(new Viewpoint(50.59778, -2.03718, 7200));
      // render graphics to the GeoView      GraphicsOverlay graphicsOverlay = new GraphicsOverlay();      mapView.getGraphicsOverlays().add(graphicsOverlay);
      // create a graphic from a line and line symbol and add to the graphics overlay      var points = new PointCollection(SpatialReferences.getWebMercator());      points.add(-226913, 6550477);      points.add(-226643, 6550477);      var line = new Polyline(points);      graphicsOverlay.getGraphics().add(new Graphic(line, lineSymbol));
      // add the map view and control panel to stack pane      stackPane.getChildren().addAll(mapView, controlsVBox);      StackPane.setAlignment(controlsVBox, Pos.TOP_LEFT);      StackPane.setMargin(controlsVBox, new Insets(10, 0, 0, 10));    } catch (Exception e) {      // on any error, display the stack trace      e.printStackTrace();    }  }
  /**   * Stops and releases all resources used in application.   */  @Override  public void stop() {
    if (mapView != null) {      mapView.dispose();    }  }
  /**   * Opens and runs application.   *   * @param args arguments passed to this application   */  public static void main(String[] args) {
    Application.launch(args);  }
}