This sample demonstrates how to generate a dot density visualization based on a set of complementary numeric fields in a FeatureLayer. This is accomplished with the createRenderer() method in the dot density renderer creator helper object.
Dot density visualizations are exclusively used for visualizing density values in polygon layers. The density is visualized by randomly placing one dot per a given value for the desired attribute. Unlike choropleth visualizations, dot density can be mapped using total counts since the size of the polygon plays a significant role in the perceived density of the attribute.
While dot density is most commonly mapped with a single attribute, you may specify up to 8 fields and/or Arcade expressions to view subsets of the data. These fields should be subsets of a common category, or in competition with one another.
This sample visualizes the number of homes in Census block groups in the United States based on the decade in which homes were constructed. If you glance at the service metadata for the layer, you’ll see a list of ten numeric fields containing a count of housing units based on the decade they were constructed.

These are complementary fields because a housing unit cannot finish construction in more than one decade. To illustrate how this method works, we expose all the competing fields to the user in a calcite-list element.
<calcite-list id="field-list" label="Home construction decades" selection-mode="multiple"> <calcite-list-item value="ACSBLT1939" label="Before 1940" selected></calcite-list-item> <calcite-list-item value="ACSBLT1940" label="1940-1949" selected></calcite-list-item> <calcite-list-item value="ACSBLT1950" label="1950-1959" selected></calcite-list-item> <calcite-list-item value="ACSBLT1960" label="1960-1969" selected></calcite-list-item> <calcite-list-item value="ACSBLT1970" label="1970-1979" selected></calcite-list-item> <calcite-list-item value="ACSBLT1980" label="1980-1989" selected></calcite-list-item> <calcite-list-item value="ACSBLT1990" label="1990-1999" selected></calcite-list-item> <calcite-list-item value="$feature.ACSBLT2000 + $feature.ACSBLT2010 + $feature.ACSBLT2014" label="After 2000" selected ></calcite-list-item> </calcite-list>Then add a function that generates the dot density renderer each time the user adds or removes a field from the visualization.
      // indicates whether the input string      // has the $feature Arcade profile variable      const isArcade = (stringValue) => {        return stringValue.indexOf("$feature") !== -1;      };
      /**       * Generates a new dot density renderer based on the selected fields in the       * list box. Returns a promise that resolves to an object containing the renderer.       */      const createRenderer = () => {        const fields = fieldList.selectedItems.map(({ value, label }) => {          return {            field: isArcade(value) ? null : value,            valueExpression: isArcade(value) ? value : null,            valueExpressionTitle: isArcade(value) ? label : null,            label,          };        });
        const params = {          view: viewElement.view,          layer: layer,          attributes: fields,          legendOptions: {            unit: "homes",          },          // Uses the scheme selected by the user          dotDensityScheme: dotDensitySymbology.getSchemeByName({            basemap: viewElement.basemap,            numColors: fields.length,            name: schemesList.value,          }),        };
        return dotDensityRendererCreator.createRenderer(params);      };
The esri/smartMapping/popup/templates module allows you to generate default popup templates that only contain information relevant to the layer’s renderer.
// Creates a popup template only containing information related to the renderer const createPopupTemplate = async (layer) => { const popupTemplates = await popupTemplateCreator.getTemplates({ layer }); const orderedListTemplate = popupTemplates.secondaryTemplates.find( (template) => template.name === "dot-density-categories-list", ).value; orderedListTemplate.title = "Most common decade for home construction"; layer.popupTemplate = orderedListTemplate; };This provides a better default popup template than the traditional approach of providing a long table of unformatted values.
| Suggested default template based on renderer | Traditional default |
|---|---|
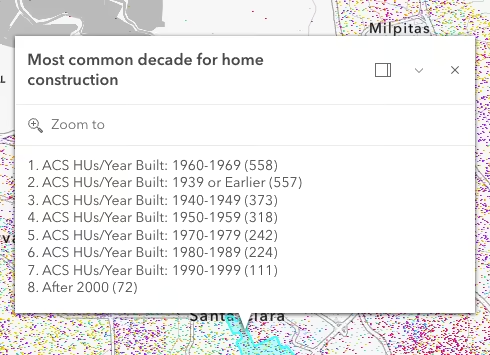 | 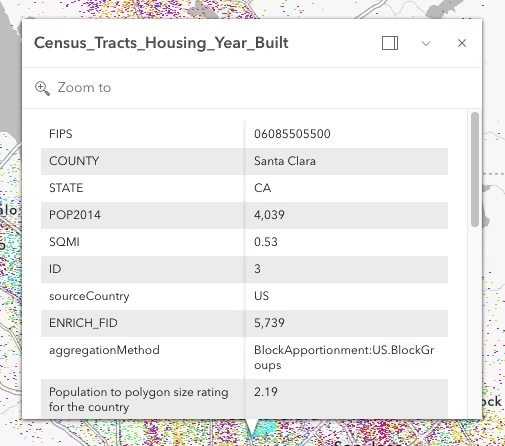 |
A word of caution
Keep in mind that generating renderers should be avoided in most applications because of the performance cost affecting the end user. As stated in the Smart Mapping guide topic, the Smart Mapping APIs were designed for two types of applications: data exploration apps and visualization authoring apps similar to ArcGIS Online. In all other cases, renderers should be saved to the layer or manually created using any of the renderer classes.
Additional visualization samples and resources
- Dot density
- Generate a predominance visualization
- Create a custom visualization using an Arcade expression