The Python API, along with the Jupyter Dashboard project enables Python developers to quickly build and prototype interactive web apps. This sample illustrates one such app which can be used to detect the changes in vegetation between the two dates. Increases in vegetation are shown in green, and decreases are shown in magenta.
This sample uses the fast on-the-fly processing power of raster functions available in the raster module of the Python API.
To run this sample you need `jupyter_dashboards` package in your conda environment. You can install it as shown below. For information on this, [refer to the install instructions](http://jupyter-dashboards-layout.readthedocs.io/en/latest/getting-started.html#installing-and-enabling)
conda install jupyter_dashboards -c conda-forge
Using this Dashboard, you can distribute your raster processing algorithms using ArcGIS Image Server and Raster Analytics.
Import IPython Widgets and Display
!conda install jupyter_dashboards -c conda-forge -yfrom ipywidgets import widgets
from IPython.display import clear_outputConnect to ArcGIS Online and Access the Landsat Services
from arcgis.gis import GIS
from arcgis.raster.functions import *

gis = GIS()

landsat_item = gis.content.search("Landsat Multispectral tags:'Landsat on AWS','landsat 8', 'Multispectral', 'Multitemporal', 'imagery', 'temporal', 'MS'", 'Imagery Layer')[0]
landsat = landsat_item.layers[0]
Create a Map and Add Landsat Layers
map1 = gis.map("California, USA")
map1
map1.add_layer(landsat)Get RFTs from Landsat Service
rfts = []
for idx,props in enumerate(landsat.properties['rasterFunctionInfos']):
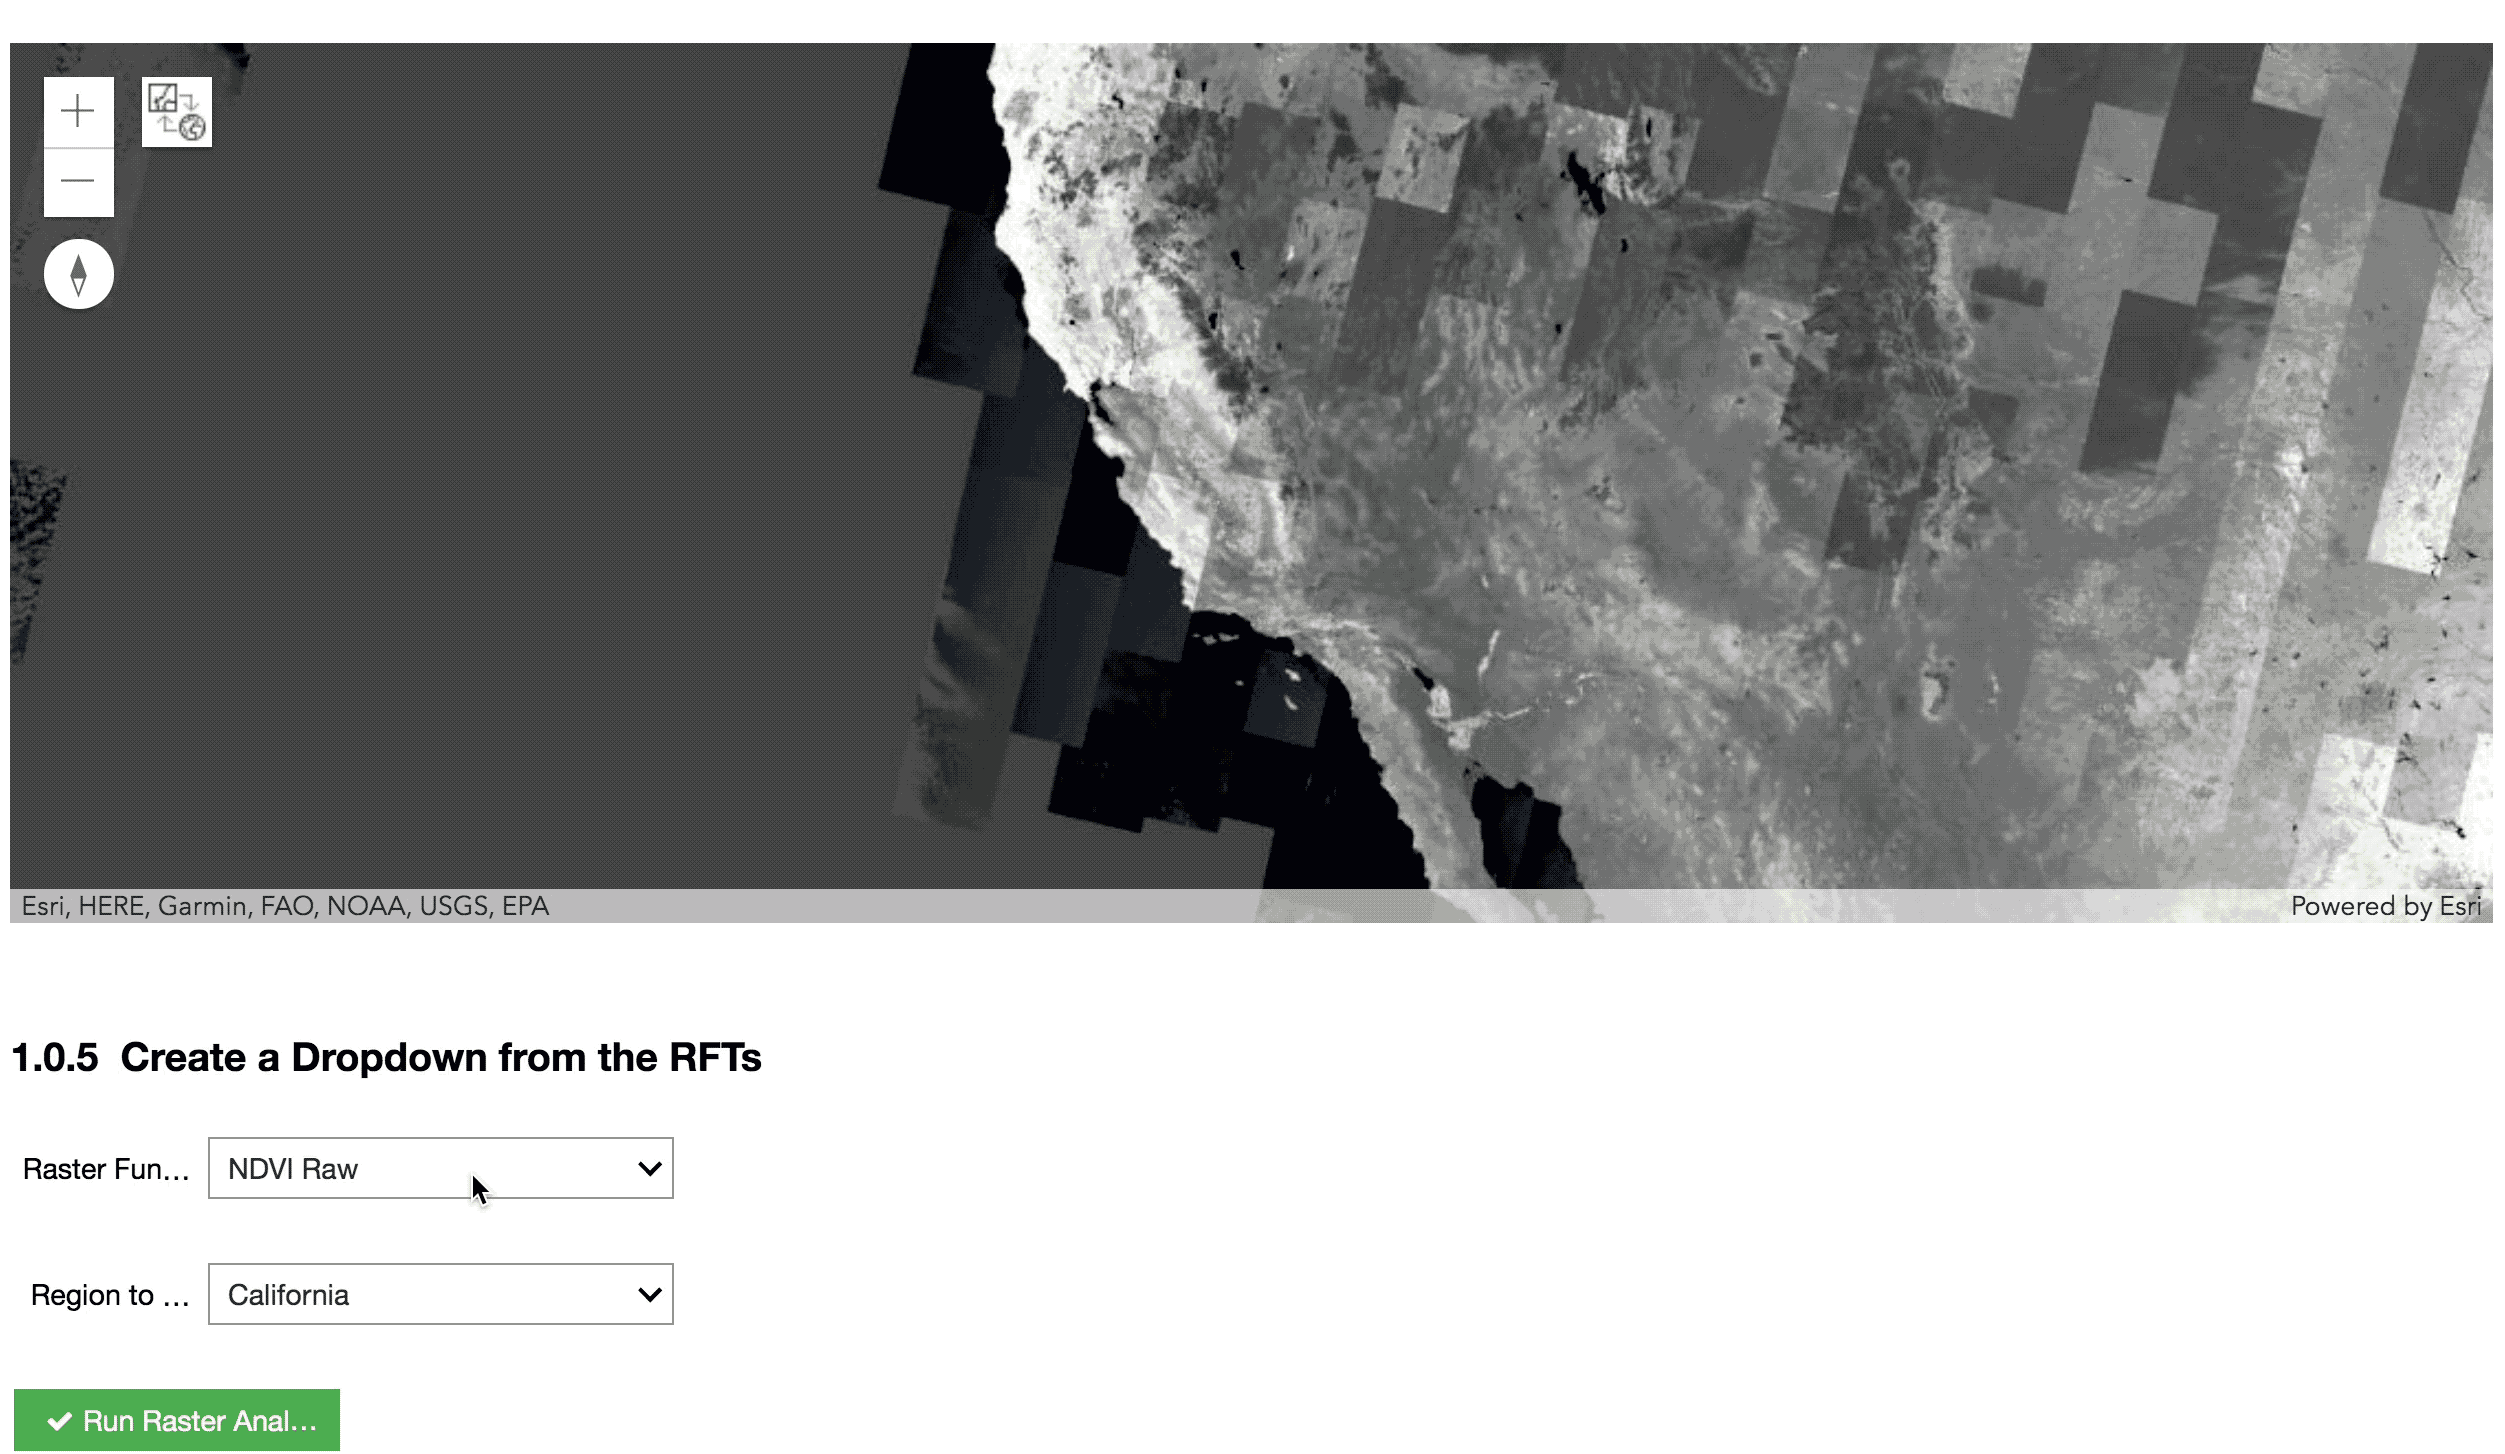
rfts.append(landsat.properties['rasterFunctionInfos'][idx]['name'])Create a Dropdown from the RFTs
rft_select = widgets.Dropdown(
    options=rfts,
    value='None',
    description='Raster Function',
    disabled=False,
)

def on_rft_change(change):
    if change['type'] == 'change' and change['name'] == 'value':
        map1.remove_layers()
        map1.add_layer(landsat, {"imageServiceParameters" :{ "renderingRule": { "rasterFunction": rft_select.value}}})

rft_select.observe(on_rft_change)
display(rft_select)
Create a List of AOIs or Study Areas We Might Want to Run Raster Analytics Over and Add Them to a Dropdown
from arcgis.geocoding import geocode
from arcgis.features import FeatureLayer

study_area_dict = {'California':'http://services.arcgis.com/PpEMp4p6SBYbe0zW/arcgis/rest/services/California_Counties/FeatureServer/0',
                   'Montana':'http://services.arcgis.com/iTQUx5ZpNUh47Geb/arcgis/rest/services/Montana_Mask/FeatureServer/0',
                   'Nevada':'http://services.arcgis.com/pGfbNJoYypmNq86F/arcgis/rest/services/28R04_Nevada_Region/FeatureServer/5',
                   'Oregon':'https://services.arcgis.com/uUvqNMGPm7axC2dD/arcgis/rest/services/Oregon_Boundary_generalized/FeatureServer/0',
                   'Texas':'http://services2.arcgis.com/5MVN2jsqIrNZD4tP/arcgis/rest/services/Texas_Outline/FeatureServer/0'}

study_areas = ['California',
               'Montana',
               'Nevada',
               'Oregon',
               'Texas']

country = widgets.Dropdown(
    options=study_areas,
    value='California',
    description='Region to Process:',
    disabled=False,
)

def on_change(change):
    if change['type'] == 'change' and change['name'] == 'value':
        location = geocode(str(country.value) + ', USA')[0]
        map1.extent = location['extent']
        #fl = FeatureLayer(study_area_dict[country.value])
        #map1.extent = fl.properties['extent']
        #print("changed to %s" % change['new'])

country.observe(on_change)

display(country)
Add A Button for Initializting a Raster Analytics Process
from datetime import datetime

def on_button_click(b):
    #map1.extentx = getextent
    clear_output()
    print("Job submitted at " + f"{datetime.now():%Y-%m-%d %H:%M:%S}")

button = widgets.Button(description="Run Raster Analytics",
                        disabled=False,
                        button_style='success',
                        tooltip='Kick Off A Raster Analytics Job',
                        icon='check')
display(button)
button.on_click(on_button_click)
Job submitted at 2021-01-05 20:28:05