Learn how to search for coffee shops, gas stations, restaurants and other nearby places with the geocoding service.
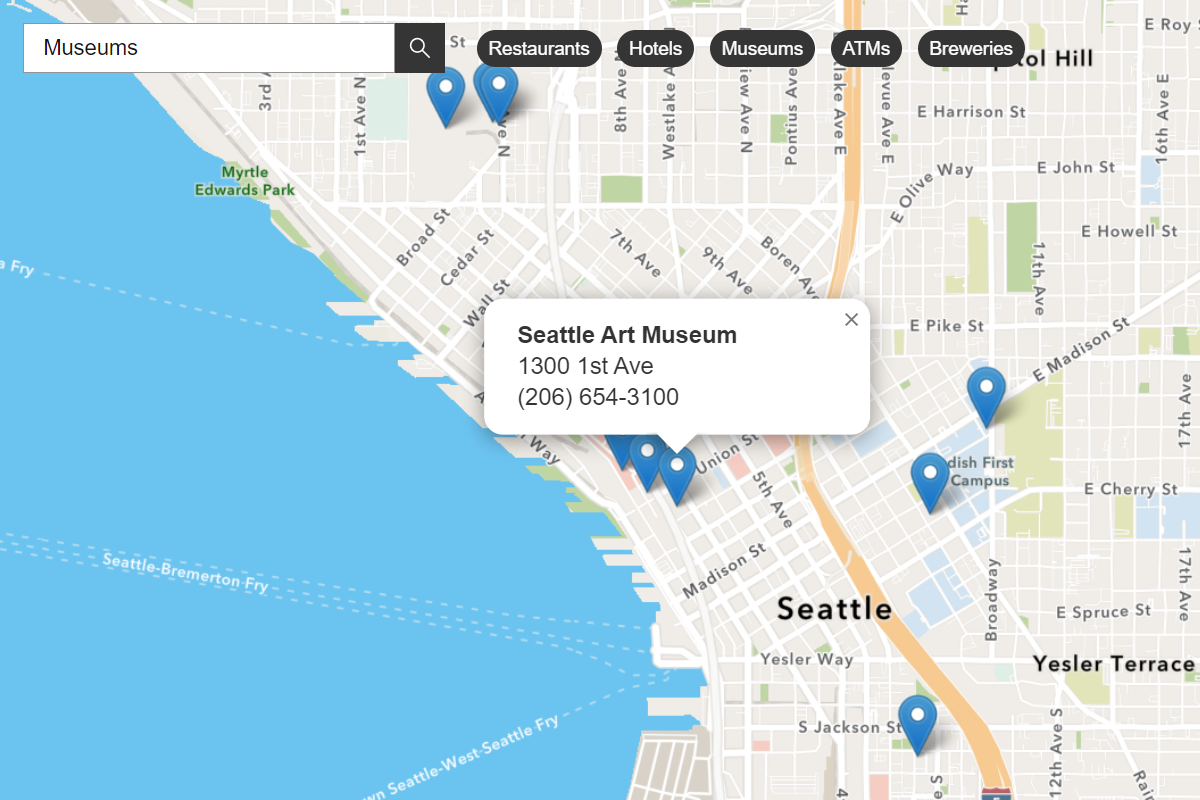
Place addresses for businesses by category with the geocoding service.
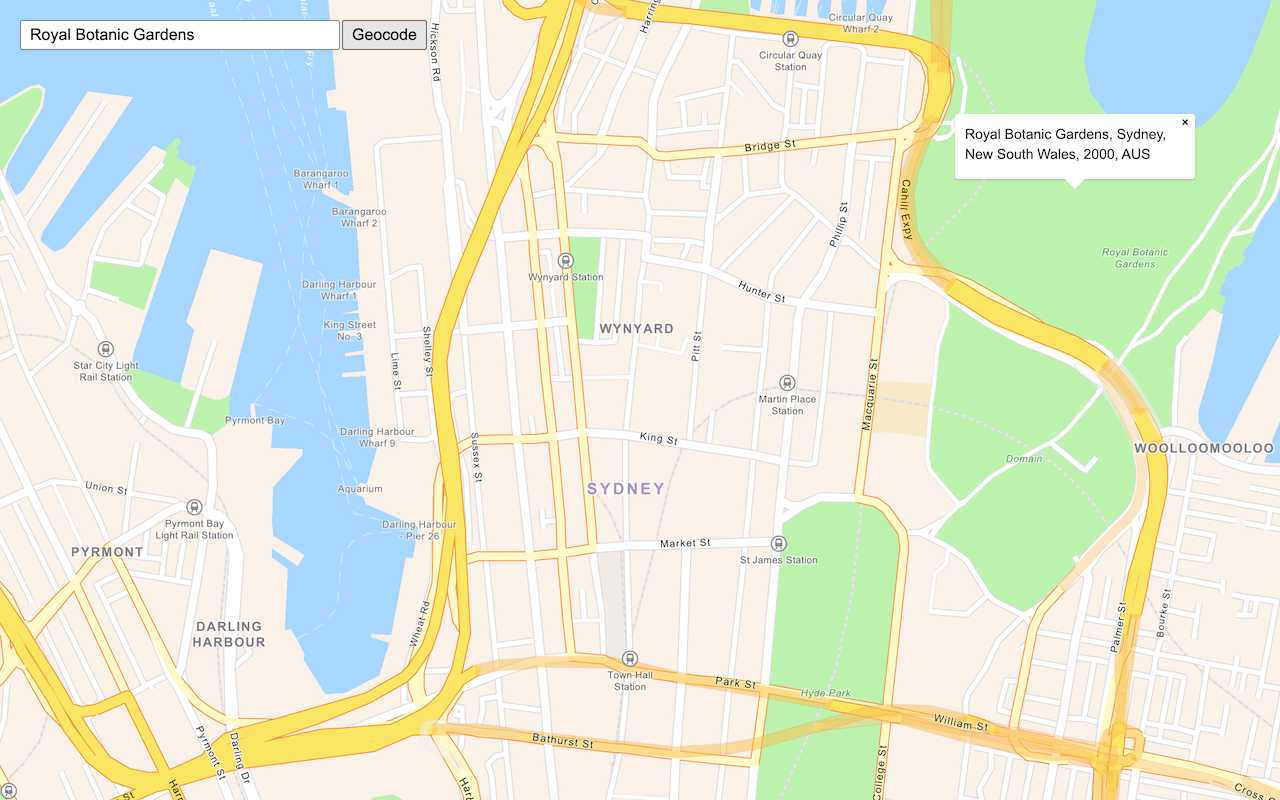
Place finding is the process of searching for a place name or POI to find its address and location. You can use the geocoding service to find places such as coffee shops, gas stations, or restaurants for any geographic location around the world. You can search for places by name or by using categories. You can search near a location or you can search globally.
In this tutorial, you use ArcGIS REST JS to access the geocoding service and find places by place category.
Prerequisites
You need an ArcGIS Location Platform or ArcGIS Online account.
Steps
Create a new pen
- To get started, either complete the Display a map tutorial or .
Get an access token
You need an access token with the correct privileges to access the resources used in this tutorial.
-
Go to the Create an API key tutorial and create an API key with the following privilege(s):
- Privileges
- Location services > Basemaps
- Location services > Geocoding
- Privileges
-
Copy the API key access token to your clipboard when prompted.
-
In CodePen, update the
accessvariable to use your access token.Token Use dark colors for code blocks const accessToken = "YOUR_ACCESS_TOKEN"; const basemapEnum = "arcgis/streets"; const map = new maplibregl.Map({ container: "map", // the id of the div element style: `https://basemapstyles-api.arcgis.com/arcgis/rest/services/styles/v2/styles/${basemapEnum}?token=${accessToken}`, zoom: 12, // starting zoom center: [-118.805, 34.027] // starting location [longitude, latitude] });
To learn about the other types of authentication available, go to Types of authentication.
Add API references
This tutorial uses ArcGIS REST JS for place finding.
-
In the
<headelement, add references to the ArcGIS REST JS library.> Use dark colors for code blocks <head> <meta charset="utf-8" /> <meta name="viewport" content="initial-scale=1,maximum-scale=1,user-scalable=no" /> <script src=https://unpkg.com/maplibre-gl@4/dist/maplibre-gl.js></script> <link href=https://unpkg.com/maplibre-gl@4/dist/maplibre-gl.css rel="stylesheet" /> <script src="https://unpkg.com/@esri/arcgis-rest-request@4/dist/bundled/request.umd.js"></script> <script src="https://unpkg.com/@esri/arcgis-rest-geocoding@4/dist/bundled/geocoding.umd.js"></script> <style> html, body, #map { padding: 0; margin: 0; height: 100%; width: 100%; font-family: Arial, Helvetica, sans-serif; font-size: 14px; color: #323232; } .places { position: absolute; top: 20px; left: 20px; } </style> </head>
Update the map
A navigation basemap layer is typically used in geocoding and routing applications. Update the basemap layer to use arcgis/navigation.
-
Update the basemap and the map initialization to center on location
[-122.4194,37.7749], San Francisco.Use dark colors for code blocks <script> const accessToken = "YOUR_ACCESS_TOKEN"; const basemapEnum = "arcgis/navigation"; const map = new maplibregl.Map({ container: "map", style: `https://basemapstyles-api.arcgis.com/arcgis/rest/services/styles/v2/styles/${basemapEnum}?token=${accessToken}`, zoom: 13, center: [-122.4194, 37.7749] // San Francisco });
Add controls
Use a select element to create the drop-down element. Each category is an option element inside it. The select element needs to have absolute positioning in order to appear in front of the map element.
-
Add a select control, with options for "Coffee shop", "Gas station", "Food", "Hotel", "Parks and outdoors". Use inline styling to position the control.
The option values have special meaning to the geocoding service so ensure the spelling is correct. To learn more, go to Category filtering in the ArcGIS services reference.
Use dark colors for code blocks <body> <div id="map"></div> <select id="places-select" style="left: 20px; top: 20px; position: absolute; font-size: 16px; padding: 4px 8px"> <option value="">Choose a category...</option> <option value="Coffee shop">Coffee shops</option> <option value="Gas station">Gas stations</option> <option value="Food">Food</option> <option value="Hotel">Hotels</option> <option value="Parks and Outdoors">Parks and Outdoors</option> </select> -
At the top right, click Run to verify that the
selectcontrol is created and contains the different categories.
Add a load event handler
You need to wait for the map to be completely loaded before adding any layers.
-
Add an event handler to the map
loadevent.Use dark colors for code blocks <script> const accessToken = "YOUR_ACCESS_TOKEN"; const basemapEnum = "arcgis/navigation"; const map = new maplibregl.Map({ container: "map", style: `https://basemapstyles-api.arcgis.com/arcgis/rest/services/styles/v2/styles/${basemapEnum}?token=${accessToken}`, zoom: 13, center: [-122.4194, 37.7749] // San Francisco }); map.once("load", () => { }); </script>
Add a map layer
To display data on the map, there must be a source that contains the data, and a layer that determines how the source will be shown.
-
Add a
geojsonsource that will contain the returned results. Set itsdataattribute to be an empty GeoJSONFeature.Collection Use dark colors for code blocks map.once("load", () => { map.addSource("places", { type: "geojson", data: { type: "FeatureCollection", features: [] } }); }); -
Add a
circlelayer that will display the source.The
geojsonsource must have data provided. You can give it aFeaturethat does not contain any features. You will provide data later.Collection Use dark colors for code blocks map.once("load", () => { map.addSource("places", { type: "geojson", data: { type: "FeatureCollection", features: [] } }); map.addLayer({ id: "places-circle", source: "places", type: "circle", paint: { "circle-color": "hsla(200, 80%, 80%, 0.7)", "circle-stroke-color": "hsl(200, 80%, 40%)", "circle-stroke-width": 1, "circle-radius": 3 } }); });
Call the geocoding service
You can use the arcgis function to retrieve places near a location. Use map.get to obtain the center of the viewport in longitude and latitude.
You will also pass the category selected by the user. Use document.get to get the control, then use its value property.
-
Create a function called
show. Inside, create a newPlaces arcgisto access the geocoding service. CallRest. Api Key Manager arcgisto set the API key and to call the service endpoint. ARest.geocode() locationwithPlaceand_addr Placeinformation will be returned based on theName categoryselected. A maximum of 25 locations will display nearest to the center of the map.Use dark colors for code blocks paint: { "circle-color": "hsla(200, 80%, 80%, 0.7)", "circle-stroke-color": "hsl(200, 80%, 40%)", "circle-stroke-width": 1, "circle-radius": 3 } }); }); function showPlaces() { const authentication = arcgisRest.ApiKeyManager.fromKey(accessToken); const category = document.getElementById("places-select").value; if (!category) { return; } arcgisRest .geocode({ authentication, outFields: "Place_addr,PlaceName", params: { category, location: map.getCenter().toArray().join(","), maxLocations: 25 } }) }
Display results
The geo property of the response object contains a GeoJSON feature collection of points. You can use this to update the data of your places source.
-
Add a response handler. Inside, use the map's
setmethod to set the returned value as GeoJSON.Data Use dark colors for code blocks params: { category, location: map.getCenter().toArray().join(","), maxLocations: 25 } }) .then((response) => { map.getSource("places").setData(response.geoJson); })
Handle errors
It is good practice to handle situations where there is a problem accessing the service. This could happen due to network disruption or a problem with your API key, for instance.
-
If there is an exception accessing the geocoding service, alert the user and log the error.
Use dark colors for code blocks .then((response) => { map.getSource("places").setData(response.geoJson); }) .catch((error) => { alert("There was a problem using the geocoder. See the console for details."); console.error(error); }); }
Add a change event handler
To update the map when the user chooses a category, you must add an event handler for the change event on the <select control.
-
Update the load event handler to call the
showfunction.Places() Use dark colors for code blocks map.addLayer({ id: "places-text", source: "places", type: "symbol", layout: { "text-field": ["get", "PlaceName"], "text-font": ["Arial Bold"], "text-variable-anchor": ["left", "right"], "text-justify": "left", "text-radial-offset": 0.5 }, paint: { "text-color": "hsl(200, 80%,40%)", "text-halo-color": "white", "text-halo-width": 2 } }); showPlaces(); -
After the map initialization code, make the
<selectcontrol control call> showwhen the user chooses an option.Places() Use dark colors for code blocks .catch((error) => { alert("There was a problem using the geocoder. See the console for details."); console.error(error); }); } document.getElementById("places-select").addEventListener("change", showPlaces); -
At the top right, click Run. When you choose a place category, circles should be shown for places.
Display place labels
You can show the name of each location by using a symbol layer with text properties.
-
In the load handler, add a
symbollayer.It is important to use a font whose glyphs are present within the map style. This style contains several variants of
Arial, which makes that a safe choice.By default, MapLibre GL JS centers text labels over their center point. Since there is a circle showing already, it is better to treat the point as the
leftanchor, and also set atext-justifyof `left.When labels are close together, not all will be shown. You could change the default settings of
text-allow-overlapif you want to alter this behavior.For more information about available style properties, see the MapLibre GL JS documentation.
Use dark colors for code blocks map.addLayer({ id: "places-circle", source: "places", type: "circle", paint: { "circle-color": "hsla(200, 80%, 80%, 0.7)", "circle-stroke-color": "hsl(200, 80%, 40%)", "circle-stroke-width": 1, "circle-radius": 3 } }); map.addLayer({ id: "places-text", source: "places", type: "symbol", layout: { "text-field": ["get", "PlaceName"], "text-font": ["Arial Bold"], "text-variable-anchor": ["left", "right"], "text-justify": "left", "text-radial-offset": 0.5 }, paint: { "text-color": "hsl(200, 80%,40%)", "text-halo-color": "white", "text-halo-width": 2 } }); showPlaces();
Run the app
In CodePen, run your code to display the map.
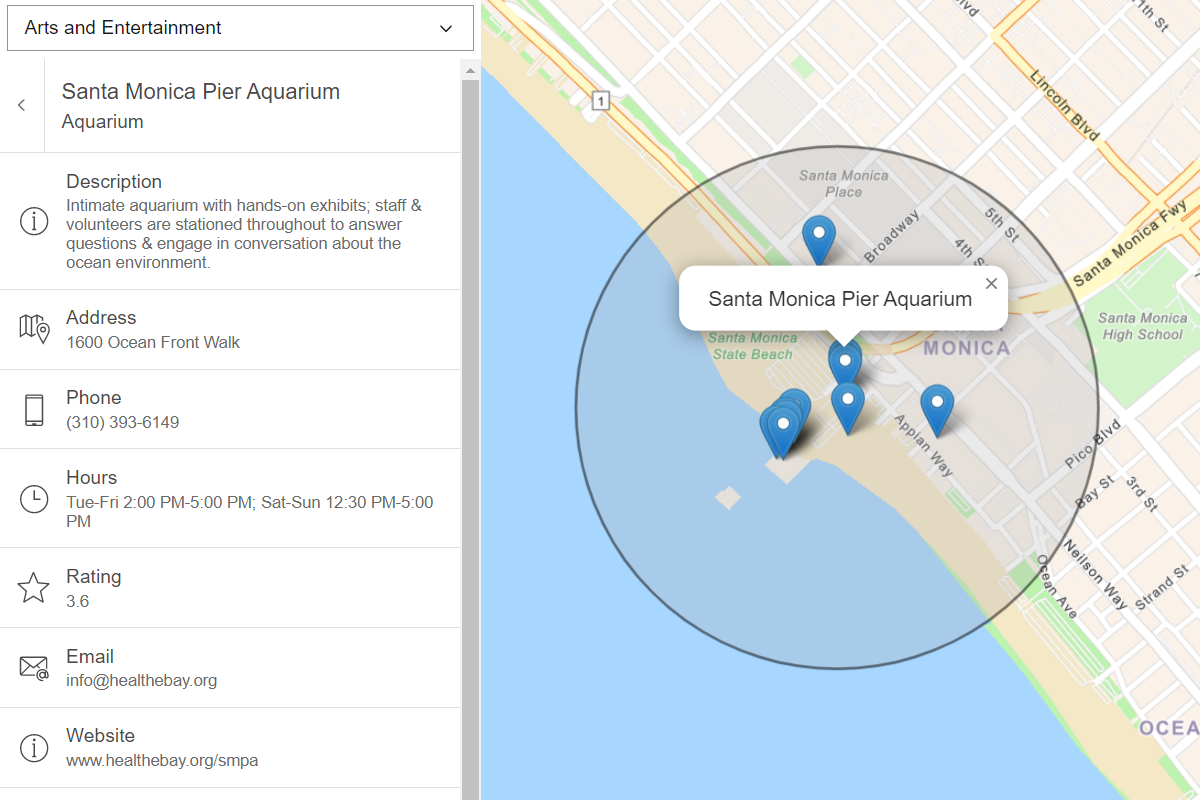
When you choose a place category, you should see the name of each place shown as a label, next to a white circle with a blue outline.
What's next?
Learn how to use additional ArcGIS location services in these tutorials: