You can style basemap layers, which are composed of vector tile data, and feature layers, which are composed of features, to help visualize the data in your application.
Basemap styles
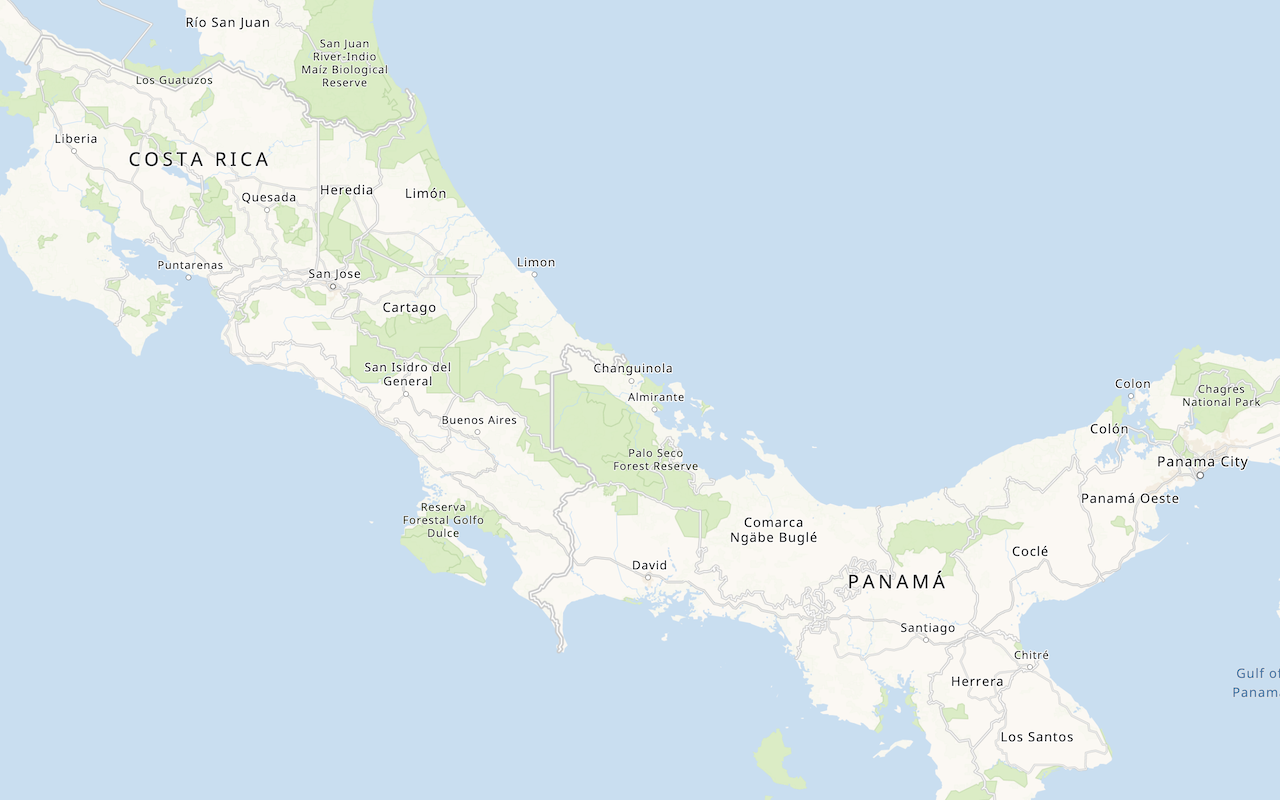
A basemap style is a set of visual properties such as fill colors, viewing levels, and fonts that define how the visual elements in a vector tile basemap layer are displayed. There are two types of basemap styles: default and custom.
- Default styles: Styles provided by Esri such as
ArcGIS,:Streets ArcGIS, and:Topographic ArcGIS.:Nova - Custom styles: Styles you create and save as items using the ArcGIS Vector Tile Style Editor.
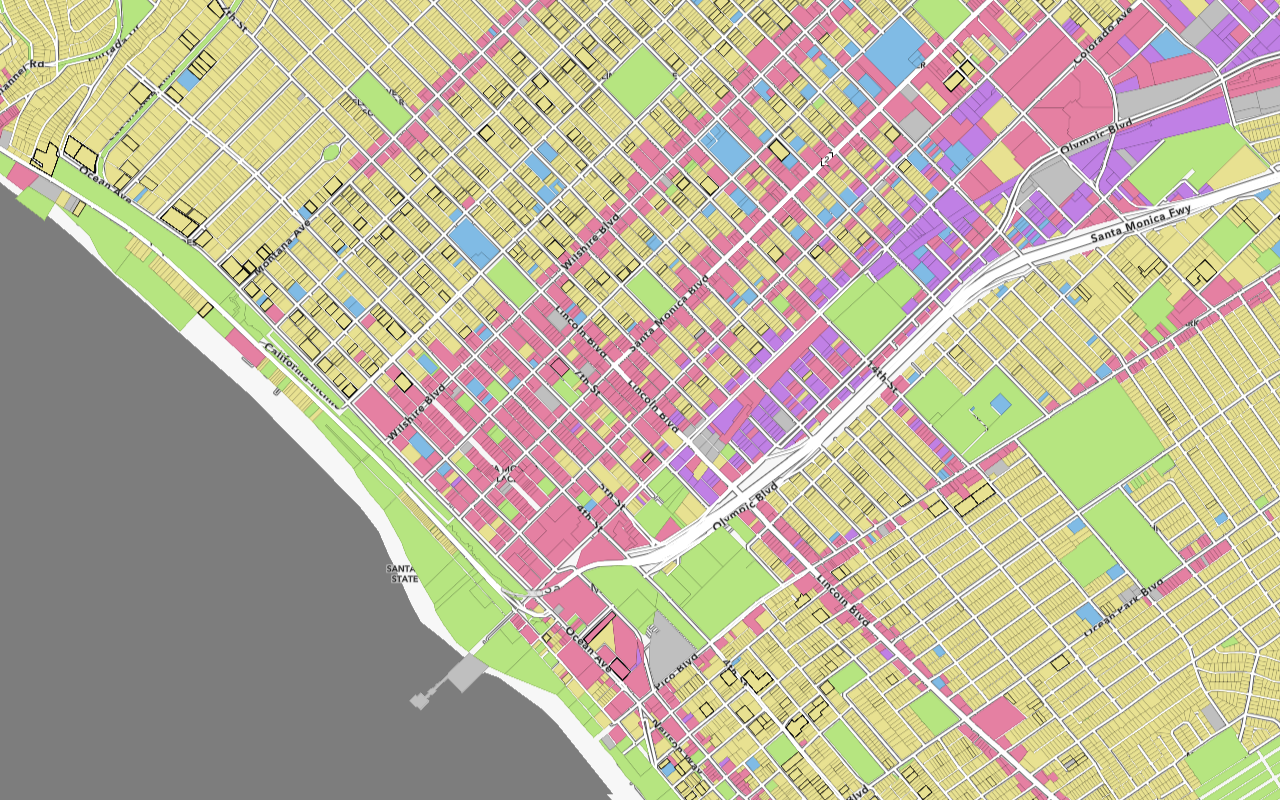
How to display a custom basemap style
- Create a style with the ArcGIS Vector Tile Style Editor.
- Go to the new basemap layer's item page and copy its item ID.
- Reference the MapLibre JS and CSS libraries.
- Set the item ID as the basemap enumeration.
- Access the basemap layer.
Example
Display a custom basemap layer
<link href="https://unpkg.com/maplibre-gl@4/dist/maplibre-gl.css" rel="stylesheet" />
<script src="https://unpkg.com/maplibre-gl@4/dist/maplibre-gl.js"></script>
<script>
const accessToken = "YOUR_ACCESS_TOKEN";
const basemapEnum = "6976148c11bd497d8624206f9ee03e30"; // Item id for custom basemap layer style
const map = new maplibregl.Map({
container: "map",
style: `https://basemaps-api.arcgis.com/arcgis/rest/services/styles/${basemapEnum}?type=style&token=${accessToken}`,
zoom: 12,
center: [-118.805, 34.027]
});
</script>Feature styles
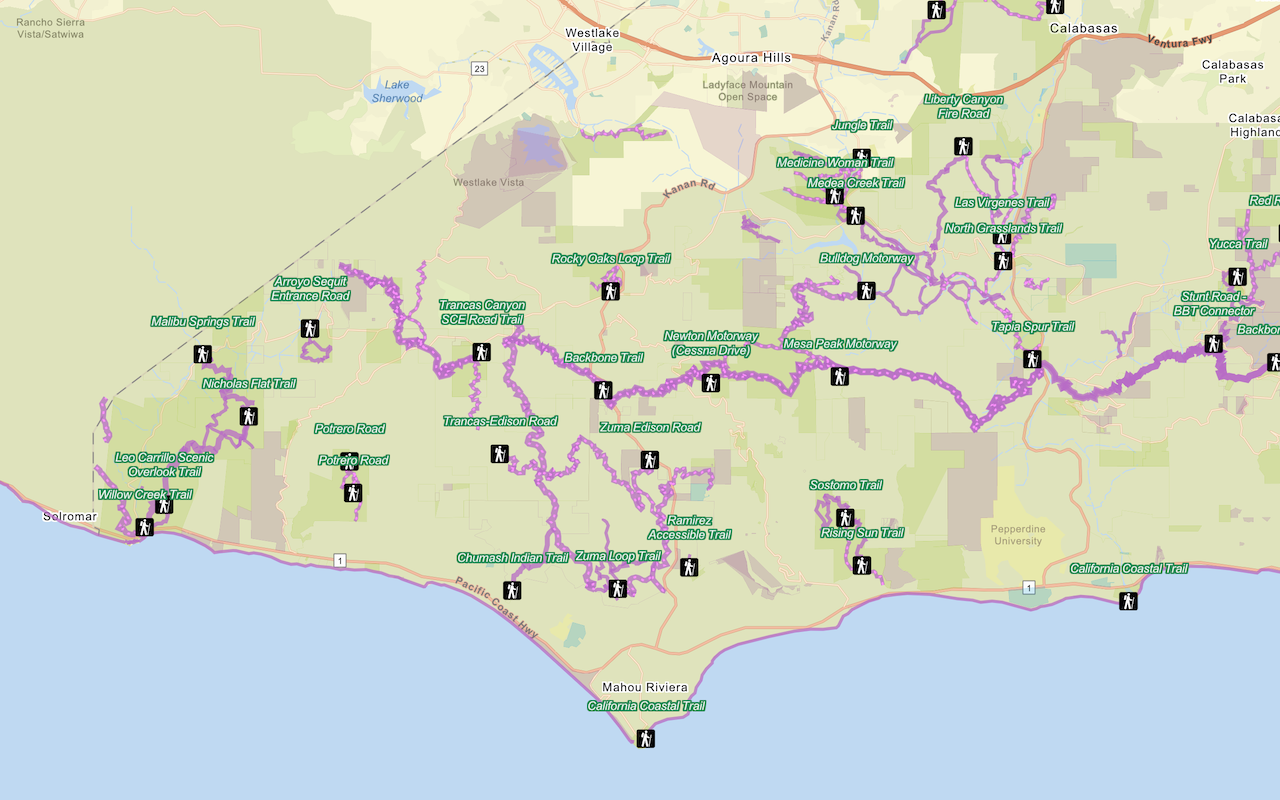
A feature layer can be styled in MapLibre GL JS with a layer connected to a GeoJSON source. Layers can contain expressions which use attribute values to calculate values.
How to style a feature layer
- Define the data type (GeoJSON) and set the feature service URL.
- Add the layer to the map and define its
id,type,source, andpaintstylings.
Example
<link href="https://unpkg.com/maplibre-gl@4/dist/maplibre-gl.css" rel="stylesheet" />
<script src="https://unpkg.com/maplibre-gl@4/dist/maplibre-gl.js"></script>
<script>
map.addSource("trails", {
type: "geojson",
data: trailsLayerURL
});
map.addLayer({
id: "trails-line",
type: "line",
source: "trails",
paint: {
"line-color": "hsl(291, 44%, 60%)",
"line-width": ["interpolate", ["linear"], ["get", "ELEV_GAIN"], 0, 3, 2300, 7],
"line-opacity": 0.75
}
});
</script>