Learn how to execute a spatial query to access polygon features from a feature service.
A feature layer can contain a large number of features stored in ArcGIS. To access a subset of these features, you can execute an SQL or spatial query, either together or individually. The results can contain the attributes, geometry, or both for each record. SQL and spatial queries are useful when a feature layer is very large and you want to access only a subset of its data.
In this tutorial, you use GL Draw to sketch a feature on the map, and then use ArcGIS REST JS to perform a spatial query against the LA County Parcels hosted feature layer. The layer contains ±2.4 million features. The spatial query returns all of the parcels that intersect the sketched feature. A pop-up is also used to display feature attributes.
Prerequisites
You need an ArcGIS Location Platform or ArcGIS Online account.
Steps
Create a new pen
- To get started, either complete the Display a map tutorial or .
Get an access token
You need an access token with the correct privileges to access the resources used in this tutorial.
-
Go to the Create an API key tutorial and create an API key with the following privilege(s):
- Privileges
- Location services > Basemaps
- Item access
- Note: If you are using your own custom data layer for this tutorial, you need to grant the API key credentials access to the layer item. Learn more in Item access privileges.
- Privileges
-
Copy the API key access token to your clipboard when prompted.
-
In CodePen, update the
accessvariable to use your access token.Token Use dark colors for code blocks const accessToken = "YOUR_ACCESS_TOKEN"; const basemapEnum = "arcgis/streets"; const map = new maplibregl.Map({ container: "map", // the id of the div element style: `https://basemapstyles-api.arcgis.com/arcgis/rest/services/styles/v2/styles/${basemapEnum}?token=${accessToken}`, zoom: 12, // starting zoom center: [-118.805, 34.027] // starting location [longitude, latitude] });
To learn about the other types of authentication available, go to Types of authentication.
Add script references
This tutorial uses three sets of libraries. ArcGIS REST JS is used for querying the feature layer. Mapbox GL Draw provides drawing tools, allowing the user to define a point, line, or polygon of interest. Terraformer is used to convert GeoJSON features generated by Mapbox GL Draw into ArcGIS JSON geometries; a requirement to query the feature layer service.
-
Add
<scripttags to reference the libraries.> Use dark colors for code blocks <head> <meta charset="utf-8" /> <meta name="viewport" content="initial-scale=1,maximum-scale=1,user-scalable=no" /> <script src=https://unpkg.com/maplibre-gl@4/dist/maplibre-gl.js></script> <link href=https://unpkg.com/maplibre-gl@4/dist/maplibre-gl.css rel="stylesheet" /> <link rel="stylesheet" href="https://api.mapbox.com/mapbox-gl-js/plugins/mapbox-gl-draw/v1.4.2/mapbox-gl-draw.css" type="text/css" /> <script src="https://api.mapbox.com/mapbox-gl-js/plugins/mapbox-gl-draw/v1.4.2/mapbox-gl-draw.js"></script> <script src="https://unpkg.com/@esri/arcgis-rest-request@4/dist/bundled/request.umd.js"></script> <script src="https://unpkg.com/@esri/arcgis-rest-feature-service@4/dist/bundled/feature-service.umd.js"></script> <script src="https://unpkg.com/@terraformer/arcgis@2.1.2/dist/t-arcgis.umd.js"></script> <style> html, body, #map { padding: 0; margin: 0; height: 100%; width: 100%; font-family: Arial, Helvetica, sans-serif; font-size: 14px; color: #323232; } </style> </head>
Add Mapbox GL Draw
To display the Mapbox GL Draw controls, create a Mapbox and call map.add. By default, other tools are included, so you need to specify the three required tools: point, line, and polygon.
-
Create a
Mapboxand add it to theDraw Map.Use dark colors for code blocks const map = new maplibregl.Map({ container: "map", // the id of the div element style: `https://basemapstyles-api.arcgis.com/arcgis/rest/services/styles/v2/styles/${basemapEnum}?token=${accessToken}`, zoom: 12, // starting zoom center: [-118.80543, 34.03] // starting location [longitude, latitude] }); const draw = new MapboxDraw({ displayControlsDefault: false, // Don't add any tools other than those below controls: { point: true, line_string: true, polygon: true } }); map.addControl(draw, "top-left"); -
Edit the
Mapboxglobal constants to allow compatibility with MapLibre GL JS.Draw Use dark colors for code blocks const map = new maplibregl.Map({ container: "map", // the id of the div element style: `https://basemapstyles-api.arcgis.com/arcgis/rest/services/styles/v2/styles/${basemapEnum}?token=${accessToken}`, zoom: 12, // starting zoom center: [-118.80543, 34.03] // starting location [longitude, latitude] }); MapboxDraw.constants.classes.CONTROL_BASE = "maplibregl-ctrl"; MapboxDraw.constants.classes.CONTROL_PREFIX = "maplibregl-ctrl-"; MapboxDraw.constants.classes.CONTROL_GROUP = "maplibregl-ctrl-group"; const draw = new MapboxDraw({ displayControlsDefault: false, // Don't add any tools other than those below controls: { point: true, line_string: true, polygon: true } }); map.addControl(draw, "top-left");
Add query layers
Three layers are required to display the three types of query you can perform: circle, line, and fill. They share a single GeoJSON source, which at any time will contain one feature of either Point, Line or Polygon geometry. Create the source with an empty GeoJSON feature collection.
A line layer can display both line features and the border of polygon features.
The circle layer should be filtered to only display point features. Otherwise, a circle will be shown at each vertex of line and polygon features. You can use a filter and the ['geometry-type'] expression. See the MapLibre Style Specification for more details.
Similarly, the fill layer should be filtered to only display polygon features. Otherwise, line features will be treated as polygons and filled inappropriately.
-
Create an
addfunction. Inside, add a GeoJSON source and circle, line, and fill layersQuery Layers Use dark colors for code blocks function addQueryLayers() { map.addSource("query", { type: "geojson", data: { type: "FeatureCollection", features: [] } }); map.addLayer({ id: "query-line", type: "line", source: "query", paint: { "line-color": "hsl(140, 0%, 30%)", "line-width": 2, "line-dasharray": [2, 2] } }); map.addLayer({ id: "query-fill", type: "fill", source: "query", paint: { "fill-color": "hsl(140, 0%, 50%)", "fill-opacity": 0.2 }, filter: ["==", ["geometry-type"], "Polygon"] }); map.addLayer({ id: "query-circle", type: "circle", source: "query", paint: { "circle-color": "hsl(140, 0%, 30%)" }, filter: ["==", ["geometry-type"], "Point"] }); }
Add parcel layers
Parcels returned by the query are simple polygons. You can display them with a GeoJSON source and a fill layer.
-
Create an
addfunction. Inside, add a GeoJSON source and a fill layer.Parcel Layers Use dark colors for code blocks map.addLayer({ id: "query-circle", type: "circle", source: "query", paint: { "circle-color": "hsl(140, 0%, 30%)" }, filter: ["==", ["geometry-type"], "Point"] }); } function addParcelLayers() { map.addSource("parcels", { type: "geojson", data: { type: "FeatureCollection", features: [] } }); map.addLayer({ id: "parcels-fill", source: "parcels", type: "fill", paint: { "fill-color": "hsl(200, 80%, 50%)", "fill-opacity": 0.5, "fill-outline-color": "white" } }); }
Add a load handler
To add layers to the map, use the load event to ensure the map is fully loaded.
-
Add an event handler for the
loadevent. Inside, calladdandQuery Layers add;Parcel Layers Use dark colors for code blocks paint: { "fill-color": "hsl(200, 80%, 50%)", "fill-opacity": 0.5, "fill-outline-color": "white" } }); } map.on("load", () => { addParcelLayers(); addQueryLayers(); });
Get the draw feature
Mapbox GL Draw emits a draw.create event when you have finished drawing a feature. You can listen to this event to respond to the newly created feature.
By default, Mapbox GL Draw keeps all previously drawn features visible in its own layer. To prevent this, use delete after copying the feature.
-
Add an event handler for
draw.create. Inside, store the feature in thequerylayer, then delete all features from Mapbox GL Draw.Use dark colors for code blocks map.on("load", () => { addParcelLayers(); addQueryLayers(); }); map.on("draw.create", (e) => { const feature = e.features[0]; map.getSource("query").setData(feature); draw.deleteAll(); }); -
Click Run at the top right to test your code. You should be able to sketch a point, line or polygon feature, and see it turn into a green feature when complete.
Execute the query
Use the ArcGIS REST JS queryFeatures method to find features in the LA County Parcels feature layer that intersect the sketched feature. Use Terraformer.geojsonToArcGIS to convert the GeoJSON from Mapbox GL Draw into the ArcGIS geometry format.
When the matching parcels are returned, you can call set on the parcels source to display them.
-
Create a function called
executewithQuery geometryandgeometryparameters. Inside, create a newType arcgisto access the feature service. CallRest. Api Key Manager arcgis. Pass theRest.query Features geometryandgeometry. Specify GeoJSON as the return type, requestingType returnand specificGeometry out. All of the features within the geometry will be returned with attribute information set by theFields outproperty.Fields There are many other spatial relationships that you can specify with
spatial. For example, you can useRel esrito only return parcels within the sketched polygon. See the ArcGIS services reference for details.Spatial Rel Contains Use dark colors for code blocks map.on("draw.create", (e) => { const feature = e.features[0]; map.getSource("query").setData(feature); draw.deleteAll(); }); function executeQuery(geometry, geometryType) { arcgisRest .queryFeatures({ url: "https://services3.arcgis.com/GVgbJbqm8hXASVYi/arcgis/rest/services/LA_County_Parcels/FeatureServer/0", geometry: geometry, geometryType: geometryType, spatialRel: "esriSpatialRelIntersects", f: "geojson", returnGeometry: true, outFields: ["APN", "UseType", "TaxRateCity", " Roll_LandValue"] }) } -
Add a response handler. Inside, set the returned parcels as the data for the parcels source.
Use dark colors for code blocks arcgisRest .queryFeatures({ url: "https://services3.arcgis.com/GVgbJbqm8hXASVYi/arcgis/rest/services/LA_County_Parcels/FeatureServer/0", geometry: geometry, geometryType: geometryType, spatialRel: "esriSpatialRelIntersects", f: "geojson", returnGeometry: true, outFields: ["APN", "UseType", "TaxRateCity", " Roll_LandValue"] }) .then((response) => { map.getSource("parcels").setData(response); }); } -
In your MapboxDraw event handler, call
execute. UseQuery Terraformer.geojsonto convertTo ArcGIS geometryinto an ArcGIS JSON format.Use dark colors for code blocks map.on("draw.create", (e) => { const feature = e.features[0]; map.getSource("query").setData(feature); draw.deleteAll(); const geometry = Terraformer.geojsonToArcGIS(feature.geometry); let geometryType = "esriGeometry" + feature.geometry.type; if (feature.geometry.type === "LineString") { geometryType = "esriGeometryPolyline"; } executeQuery(geometry, geometryType); }); -
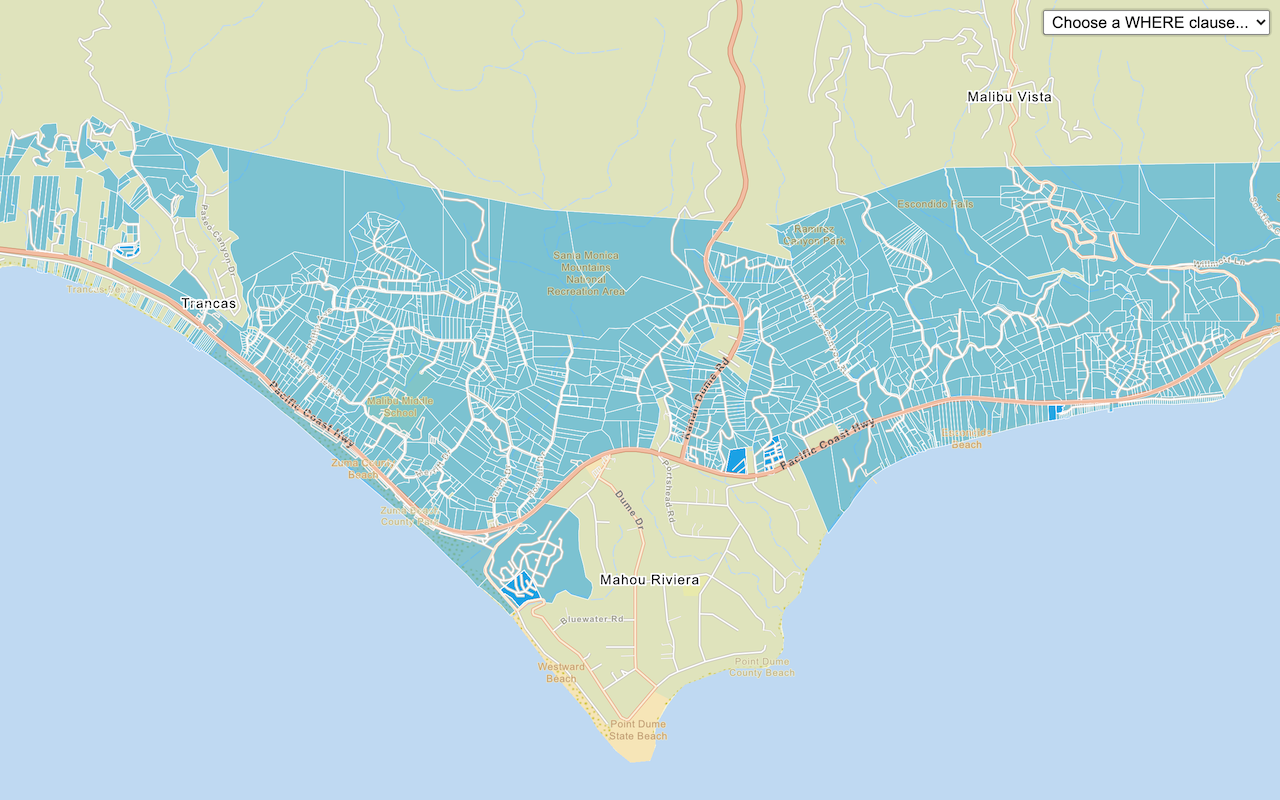
At the top right, click Run. When you create a feature using the toolbox, a spatial query will run against the feature layer and display all land parcels within the boundary of the feature.
Add a pop-up
You can add a pop-up to view attributes of a parcel when you click on it.
-
Add a
clickevent handler to theparcels-filllayer. Inside, construct the pop-up content from the attributes of the clicked parcel.Use dark colors for code blocks .then((response) => { map.getSource("parcels").setData(response); }); } map.on("click", "parcels-fill", (e) => { const p = e.features[0].properties; const message = `<b>Parcel ${p.APN}</b>` + `Type: ${p.UseType} <br>` + `Land value: $${p.Roll_LandValue.toLocaleString()} <br>` + `Tax Rate City: ${p.TaxRateCity}`; }); -
Create a Popup. Use
Popup.setto set the content. Update the position of the pop-up usingHTML Popup.set, and add it to the map usingLng Lat Popup.add.To Use dark colors for code blocks map.on("click", "parcels-fill", (e) => { const p = e.features[0].properties; const message = `<b>Parcel ${p.APN}</b>` + `Type: ${p.UseType} <br>` + `Land value: $${p.Roll_LandValue.toLocaleString()} <br>` + `Tax Rate City: ${p.TaxRateCity}`; new maplibregl.Popup().setHTML(message).setLngLat(e.lngLat).addTo(map); });
Run the app
In CodePen, run your code to display the map.
When you click on the map to draw a polygon, a spatial query will run against the feature layer and display all land parcels that intersect the boundary of the feature. You can click on a parcel to see a pop-up with information about the parcel, or click somewhere else to reset the map.
What's next?
Learn how to use additional ArcGIS location services in these tutorials:
Query a feature layer (SQL)
Execute a SQL query to access polygon features from a feature layer.
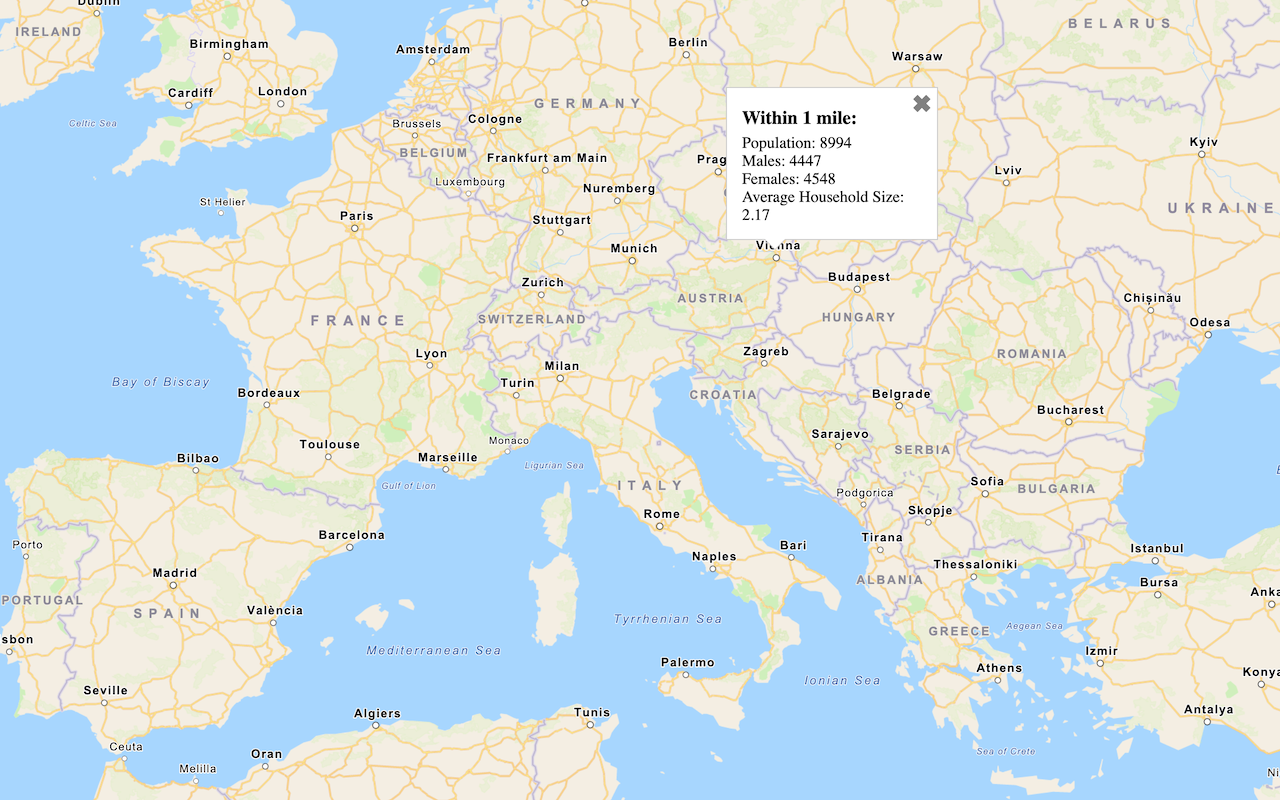
Get global data
Query demographic information for locations around the world with the GeoEnrichment service.
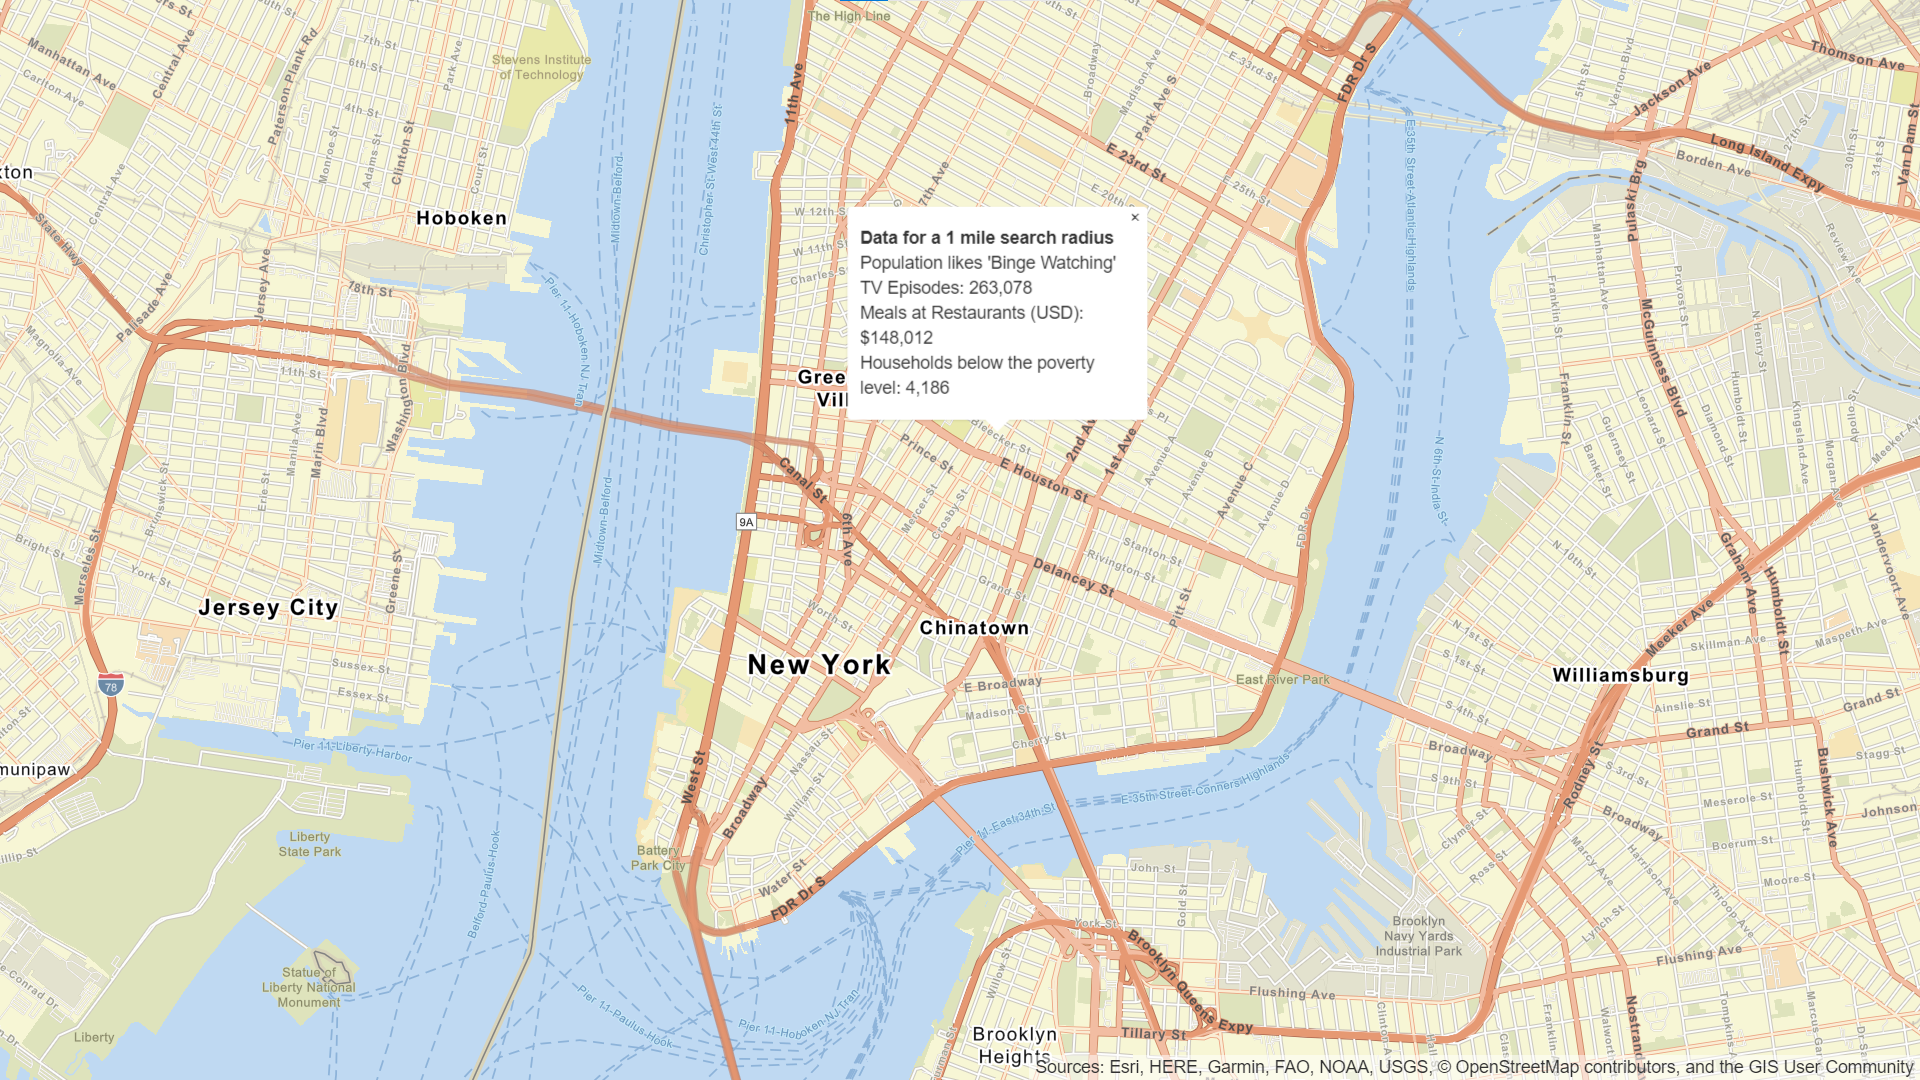
Get local data
Query regional facts, spending trends, and psychographics with the GeoEnrichment service.
Add a feature layer
Add features from feature layers to a map.
Style a feature layer
Use data-driven styling to apply symbol colors and styles to feature layers.