To display points, polylines, polygons, and text on a static map, send a POST request to the /with-overlay endpoint of the ArcGIS Static Maps serviceoverlay in the request body. Define each overlay item using its type, geometry, and symbol properties. Additionally, you can specify the image image.width and image.height in pixels, along with the output format (png, jpeg, or webp).
How to display a map with multiple geometries
The typical workflow to display a static map with multiple geometries is:
- Map: Define the
basemapas path parameter and the map area withStyle center.xandcenter.y, andzoomorradiusin the request body. - Overlay: Define the
overlay, which is an array of text, points, polylines, and/or polygons with their associated symbols and labels in the request body. - Image: Specify the image
heightandwidthin pixels,format, andattributionstyle in the request body. - Request: Send a
POSTrequest to the/with-overlayendpoint to generate the static map.
Service URL
https://static-maps-api.arcgis.com/arcgis/rest/services/static-maps-service/v1/static-mapsPath parameters
These are required parameters to specify the style to access.
https://static-maps-api.arcgis.com/arcgis/rest/services/static-maps-service/{version}/static-maps/{basemapStyle}/with-overlay| Name | Description | Example |
|---|---|---|
{version} | Required: The version of the static maps service. | v1 |
{basemap | Required: The basemap style for the static map. | arcgis/navigation, arcgis/navigation-night, arcgis/imagery, arcgis/streets-night, or arcgis/streets |
Body parameters
| Name | Type | Required | Default value | Description |
|---|---|---|---|---|
overlay | Overlay | | An array of elements to display on the static map, including point, polyline, polygon and/or text. Supports up to 64 geometries. | |
symbolDictionary | SymbolDictionary | | Dictionary of custom SVG marker symbols keyed by a unique ID. Values must be base64 data URLs referenced via | |
image | Image | | The image object defines the image | |
map | Map | | A map view that specifies the center location, visible geographic area of the map, and basemap reference details. |
Code examples
Display multiple geometries and text for incident response
Use the Static Maps service to generate an incident response map with custom symbols for police units, fire engines, and road closures, polylines marking closed roads, and polygons highlighting incident areas. Add text overlays to display a map title and identify response units.
Steps
- Reference the service.
- Set the API key in the
Authorizationrequest header using theBearerauthentication scheme. - Define the request body parameters, including the
overlayarray containing text, point, polyline, and polygon geometries with their associated symbols and labels. - Send the request to the Static Maps service to generate the static map.
fetch(
`https://static-maps-api.arcgis.com/arcgis/rest/services/static-maps-service/v1/static-maps/${basemapStyle}/with-overlay`,
{
method: "POST",
headers: {
Authorization: `Bearer ${accessToken}`,
"Content-Type": "application/json",
accept: "image/png",
},
body: JSON.stringify(requestBody),
}
)
.then((response) => response.blob())
.then((blob) => {
const imgUrl = URL.createObjectURL(blob);
mapImage.src = imgUrl;
});
REST API
curl -X POST "https://static-maps-api.arcgis.com/arcgis/rest/services/static-maps-service/v1/static-maps/arcgis/streets-night/with-overlay" \
-H "Authorization: Bearer <ACCESS_TOKEN>" \
-H "Content-Type: application/json" \
-d '{
"overlay": [
{
"type":"text",
"geometry": {
"x": -87.5851853,
"y": 41.7369154,
"spatialReference": {
"wkid": 4326
}
},
"symbol":{

Display a point with a custom symbol
Use the Static Maps service to generate a static map with the locations of animal enclosures in San Diego Zoo, California. The map uses the ArcGIS Imagery basemap style and has a custom marker symbol that represents each animal.
Steps
- Reference the service.
- Set the API key in the
Authorizationrequest header using theBearerauthentication scheme. - Define the request body parameters, including the
overlayarray containing point, polyline, and polygon geometries with their associated symbols and labels. - Send the request to the Static Maps service to generate the static map.
const res = await fetch(
`https://static-maps-api.arcgis.com/arcgis/rest/services/static-maps-service/v1/static-maps/${basemapStyle}/with-overlay`,
{
method: "POST",
headers: {
"Content-Type": "application/json",
Authorization: `Bearer ${accessToken}`,
accept: "image/png",
},
body: JSON.stringify(body),
}
);
const blob = await res.blob();
const mapEl = document.getElementById("parkMap");
mapEl.src = URL.createObjectURL(blob);
mapEl.style.display = "block";
REST API
curl -X POST "https://static-maps-api.arcgis.com/arcgis/rest/services/static-maps-service/v1/static-maps/arcgis/imagery/with-overlay" \
-H "Content-Type: application/json" \
-H "Authorization: Bearer <ACCESS_TOKEN>" \
-d '{
"overlay": [
{
"type": "point",
"geometry": {
"x": -117.1534621,
"y": 32.7369592,
"spatialReference": { "wkid": 4326 }
},
"symbol": {
"customSymbolId": "placeIcon",
"scale": 2
}
}
],
"image": {
"width": 500,
"height": 250,
"format": "png"
},
"map": {
"radius": 300,
"center": {
"x": -117.1516,
"y": 32.73525,
"spatialReference": {
"wkid": 4326
}
}
},
"symbolDictionary": {
"placeIcon": "<BASE64_SVG>"
}
}'
Display a polyline for GPS tracks
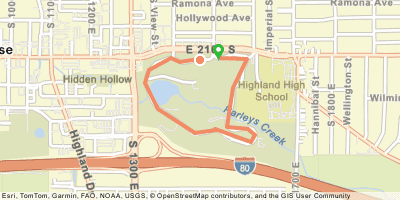
Use the Static Maps service to display a route taken during a recent exercise. The route is symbolized with a solid orange line, a custom start symbol, and a custom end symbol. The image is displayed in a fitness app along with details such as distance, duration, total calories burned, and total steps gained.
Steps
- Reference the service.
- Define the request body parameters, including the
overlayarray containing point and polyline geometries with their associated symbols and labels. - Set the API key in the
Authorizationrequest header using theBearerauthentication scheme. - Send the request to the Static Maps service to generate the static map.
const res = await fetch(
`https://static-maps-api.arcgis.com/arcgis/rest/services/static-maps-service/v1/static-maps/${basemapStyle}/with-overlay`,
{
method: "POST",
headers: {
"Content-Type": "application/json",
Authorization: `Bearer ${accessToken}`,
accept: "image/png",
},
body: JSON.stringify(requestBody),
}
);
console.log(res);
const blob = await res.blob();
routeMap.src = URL.createObjectURL(blob);
routeMap.style.display = "block";
}
REST API
curl -X POST "https://static-maps-api.arcgis.com/arcgis/rest/services/static-maps-service/v1/static-maps/arcgis/navigation/with-overlay" \
-H "Content-Type: application/json" \
-H "Authorization: Bearer <ACCESS_TOKEN>" \
-H "Accept: image/png" \
-d '{
"overlay": [
{
"type": "polyline",
"geometry": {
"paths": [[
[-111.84901320943004, 40.725307451459514],
[-111.85038839867565, 40.72512620217646],
[-111.85102218154537, 40.72537088859197],
[-111.85260065963597, 40.72470026441834],
[-111.85292353015451, 40.72397525771017],
[-111.8519549185989, 40.722606786026645],
[-111.84930020544651, 40.72128360122053],
[-111.84776956002533, 40.721437672037354],
[-111.84788914169884, 40.72150111285826],
[-111.84534205205264, 40.72076700823226],
[-111.8449952651994, 40.7211929711617],
[-111.84549750822823, 40.72147392394242],
[-111.84699227914739, 40.721609868410575],
[-111.84662157595942, 40.72372150349648],
[-111.84559317356705, 40.72528026409853],
[-111.84767246019886, 40.72533240136366]
]],
"spatialReference": {
"wkid": 4326
}
},
"symbol": {
"width": 4,
"style": "solid",
"color": "f18c67"
}
},
{
"type": "point",
"geometry": {
"x": -111.84901320943004,
"y": 40.725307451459514,
"spatialReference": {
"wkid": 4326
}
},
"symbol": {
"customSymbolId": "run",
"scale": 2
}
},
{
"type": "point",
"geometry": {
"x": -111.84767246019886,
"y": 40.72533240136366,
"spatialReference": {
"wkid": 4326
}
},
"symbol": {
"customSymbolId": "flag",
"scale": 1
}
}
],
"symbolDictionary": {
"run": "<BASE64_SVG>",
"flag": "<BASE64_SVG>"
},
"image": {
"width": 400,
"height": 200,
"format": "png",
"padding": [20]
},
"map": {
"zoom": 14
}
}'
Display a polyline for a routing result
You can use the Static Maps service together with the Geocoding and Routing services to display a route from two points. First, create search inputs with autosuggest to help users select start and destination addresses. Then, geocode the selected addresses to obtain their coordinates and pass them to the Routing service to generate a route. Finally, use the resulting route geometry with the Static Maps service to create a static map that displays the route between the two locations.
Steps
- Reference the Static Maps service, Geocoding service, and Routing service endpoints.
- Set the API key in the
Authorizationrequest header using theBearerauthentication scheme. Your API key needs Geocoding, Routing, and Static Maps services privileges. - Use user input to call
/suggestand display address suggestions. - Get the coordinates of the selected location with
/find.Address Candidates - Pass the coordinates of the start and destination locations to
/solveto generate a route. - Pass the resulting route geometry to the Static Maps service to create a static map that displays the route between the two locations.
async function updateMapRoute(routePaths) {
const width = Math.max(64, Math.min(mapDiv.clientWidth, 1024));
const height = Math.max(64, Math.min(mapDiv.clientHeight, 1024));
const startPoint = routePaths[0];
const endPoint = routePaths[routePaths.length - 1];
const body = {
overlay: [
{
type: "polyline",
geometry: {
paths: [routePaths],
spatialReference: {
wkid: 4326,
},
},
symbol: {
style: "solid",
color: "4285F4",
width: 4,
},
},
{
type: "point",
geometry: {
x: startPoint[0],
y: startPoint[1],
spatialReference: {
wkid: 4326,
},
},
symbol: {
customSymbolId: "start",
scale: 2.5,
offsetY: -8,
},
},
{
type: "point",
geometry: {
x: endPoint[0],
y: endPoint[1],
spatialReference: {
wkid: 4326,
},
},
symbol: {
customSymbolId: "end",
scale: 2.5,
offsetY: -8,
},
},
],
image: {
width,
height,
format: "png",
padding: [20],
},
symbolDictionary: {
start: svgToBase64(
"<" +
'svg xmlns="http://www.w3.org/2000/svg" viewBox="0 2 21 29"><path d="M10.5 1.998a5.4 5.4 0 0 0-5.4 5.4c0 2.982 3.9 6.6 5.4 11.6 1.521-4.98 5.4-8.618 5.4-11.6a5.4 5.4 0 0 0-5.4-5.4zm0 7.8a2.3 2.3 0 1 1 0-4.599 2.3 2.3 0 0 1 0 4.599z" fill="#34A853"/><circle cx="10.5" cy="7.4" r="2.3" fill="#ffffff"/></svg>'
),
end: svgToBase64(
'<svg xmlns="http://www.w3.org/2000/svg" viewBox="0 2 21 29"><path d="M10.5 1.998a5.4 5.4 0 0 0-5.4 5.4c0 2.982 3.9 6.6 5.4 11.6 1.521-4.98 5.4-8.618 5.4-11.6a5.4 5.4 0 0 0-5.4-5.4zm0 7.8a2.3 2.3 0 1 1 0-4.599 2.3 2.3 0 0 1 0 4.599z" fill="#EA4335"/><circle cx="10.5" cy="7.4" r="2.3" fill="#ffffff"/></svg>'
),
},
};
const res = await fetch(
`https://static-maps-api.arcgis.com/arcgis/rest/services/static-maps-service/v1/static-maps/${basemapStyle}/with-overlay`,
{
method: "POST",
headers: {
"Content-Type": "application/json",
Authorization: `Bearer ${accessToken}`,
accept: "image/png",
},
body: JSON.stringify(body),
}
);
const blob = await res.blob();
const imgUrl = URL.createObjectURL(blob);
mapDiv.innerHTML = `<img src="${imgUrl}" alt="Route map" />`;
}
REST API
curl -X POST "https://static-maps-api.arcgis.com/arcgis/rest/services/static-maps-service/v1/static-maps/arcgis/navigation-night/with-overlay" \
-H "Content-Type: application/json" \
-H "Authorization: Bearer <ACCESS_TOKEN>" \
-H "Accept: image/png" \
-d '{
"overlay": [
{
"type": "polyline",
"geometry": {
"paths": [[
[-122.34053899999998, 47.60855500000008],
[-122.33999999999997, 47.60796400000004],
[-122.33966489999995, 47.60759540000004],
[-122.34020739999994, 47.60736330000003],
[-122.34016089999994, 47.607312000000036],
[-122.3393127, 47.60637520000006]
]],
"spatialReference": { "wkid": 4326 }
},
"symbol": {
"style": "solid",
"width": 4,
"color": "007ac2"
}
},
{
"type": "point",
"geometry": {
"x": -122.34053899999998,
"y": 47.60855500000008,
"spatialReference": { "wkid": 4326 }
},
"symbol": {
"customSymbolId": "start",
"scale": 2.5
}
},
{
"type": "point",
"geometry": {
"x": -122.3393127,
"y": 47.60637520000006,
"spatialReference": { "wkid": 4326 }
},
"symbol": {
"customSymbolId": "end",
"scale": 2.5
}
}
],
"image": {
"width": 1024,
"height": 861,
"format": "png"
},
"symbolDictionary": {
"start": "<BASE64_SVG>",
"end": "<BASE64_SVG>"
}
}'
Display a polygon for a drive-time area
Use the Static Maps service together with the Geocoding and Routing services to display a 10-minute drive time area from a geocoding result. First, create a search box with autosuggest to help users select an address. Then, geocode the selected address to obtain its coordinates, and pass those coordinates to the Routing service to generate a 10-minute drive time area. Finally, use the Static Maps service to generate a static map that displays the drive time area as a polygon.
Steps
- Reference the Static Maps service, Geocoding service, and Routing service endpoints.
- Set the API key in the
Authorizationrequest header using theBearerauthentication scheme. Your API key needs Geocoding, Routing, and Static Maps services privileges. - Use user input to call
/suggestand display address suggestions. - Get the coordinates of the selected location with
/find.Address Candidates - Pass the coordinates to
/solveto generate a 10-minute drive time area.Service Area - Pass the resulting drive-time polygon to the Static Maps service to generate a static map that displays the drive-time area.
const requestBody = {
overlay: [
{
type: "polygon",
geometry: {
rings: [polygon],
spatialReference: {
wkid: 4326,
},
},
symbol: {
style: "solid",
color: "8B6DFF40",
outline: {
style: "solid",
color: "5A2DCCFF",
width: 1,
},
},
},
{
type: "point",
geometry: {
x: location.x,
y: location.y,
spatialReference: {
wkid: 4326,
},
},
},
],
image: {
width,
height,
format: "png",
},
};
const response = await fetch(
`https://static-maps-api.arcgis.com/arcgis/rest/services/static-maps-service/v1/static-maps/${basemapStyle}/with-overlay`,
{
method: "POST",
headers: {
"Content-Type": "application/json",
Authorization: `Bearer ${accessToken}`,
accept: "image/png",
},
body: JSON.stringify(requestBody),
}
);
REST API
curl -X POST \
"https://static-maps-api.arcgis.com/arcgis/rest/services/static-maps-service/v1/static-maps/arcgis/navigation/with-overlay" \
-H "Content-Type: application/json" \
-H "Authorization: Bearer <ACCESS_TOKEN>" \
-d '{
"overlay": [
{
"type": "polygon",
"geometry": {
"rings": [
<polygon>
],
"spatialReference": {
"wkid": 4326
}
},
"symbol": {
"style": "solid",
"color": "30009f70",
"outline": {
"style": "solid",
"color": "30009fbd",
"width": 2
}
}
},
{
"type": "point",
"geometry": {
"x": -117.1956,
"y": 34.0567,
"spatialReference": {
"wkid": 4326
}
}
}
],
"image": {
"width": 800,
"height": 600,
"format": "png"
}
}'
Tutorials
Display a complex static map
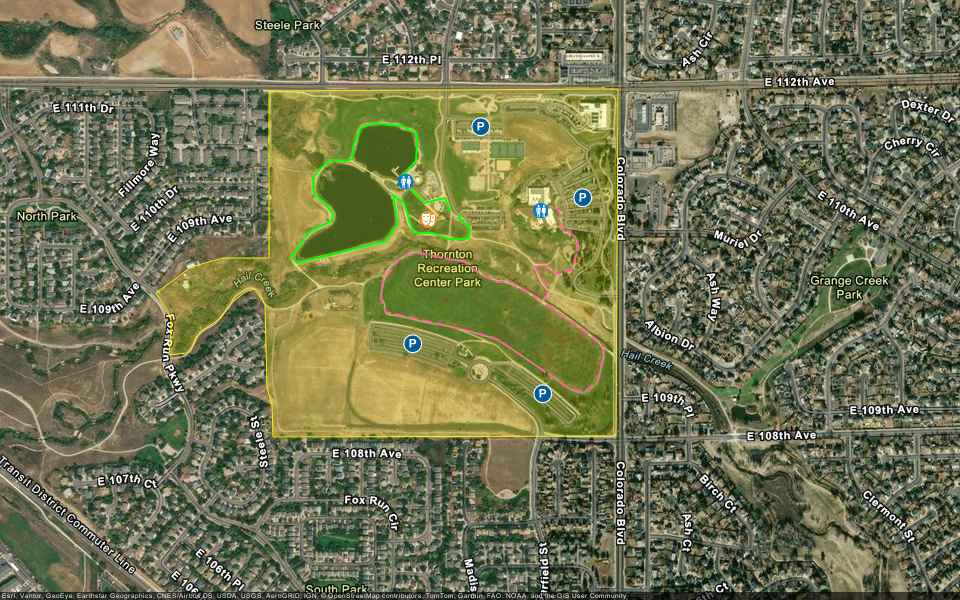
Display a static map with multiple geometries and custom marker symbols.