Composite Bands creates a single output raster by stacking selected bands from one or more input rasters into a unified multiband raster.

Usage notes
- Composite Bands spatially bins tiles so tiles covering the same output area are processed together, merges overlapping or duplicate tiles within each bin to produce a single reconciled raster per input, and then stacks the selected band Ids from those merged rasters into the output in input and band Id order.
- This tool can also create a raster containing a subset of the original raster bands. This is useful if you need to create a new raster with a specific band combination and order.
- The output band schema is determined by the bands specified in the
.addconfiguration. The output raster includes one band for each requested band Id, so band count is defined by what you specify rather than by scanning every input tile at runtime. This ensures consistent output band count across all tiles, including areas where an input tile is completely missing.Raster() - The order that the bands are listed in the
.addwill determine the order of the bands in the output raster.Raster() - By default, the output raster takes the spatial reference of the first raster in the list.
You can change this by setting the output coordinate system in the
.set.Output Properties() - The output raster takes the cell size and grid origin from the first raster band in the list. You can change this by setting the properties in the
.set.Output Properties() - The following are some examples of why you would want to combine single rasters into multiband rasters:
- You may have received some satellite data where each band of data is contained in a single file—for example, band1.tif, band2.tif, and band3.tif. To render these rasters together to create a color composite, each band needs to be contained within a single raster dataset (for example, allbands.tif).
- You may have several rasters of the same area captured at various times. By displaying these rasters as a color composite, you can detect change in the area, such as urban growth or cut forests. To create this color composite, each raster dataset needs to be contained as individual bands within a single raster dataset.
- In some cases, the output of an analysis operation is a single-band raster dataset. To do further visual analysis, you may need to combine the outputs by rendering your data as a color composite.
- Combining bands into one raster dataset can help you organize many related single-band rasters.
- All bands in the output raster use a common spatial reference and extent. Only band values and masks vary by band.
- The output extent will be the union extent of the two rasters. No data values will be added in areas where there are no pixels.
Limitations
- Band count and order are driven by specified band Ids. Including bands not needed for analysis may increase memory and processing.
- Using input rasters with mixed spatial references, cell or tile sizes may increase resample and merge work substantially.
Results
The tool returns a DataFrame containing the composite raster.
| Field | Description |
|---|---|
composite | The multiband raster generated from combining selected bands across input rasters. |
Performance notes
Improve the performance of Composite Bands by doing one or more of the following:
- Limit processing to the area of interest (for example by filtering or clipping to an extent).
- Use fewer bands in the
.addsetter.Raster() - Limit the number of tiles by using the
.setsetter.Tile Size()
Similar capabilities
The following tools complete raster related operations:
Syntax
For more details, go to the GeoAnalytics Engine API reference for composite bands.
| Setter (Python) | Setter (Scala) | Description | Required |
|---|---|---|---|
run() | run() | Runs the Composite bands tool. | Yes |
add | add | Specifies which raster dataframe to add, the raster column to use and which band Ids to take from each input raster. The selected bands are appended to the output in input order. | Yes |
set | set | Overrides output grid properties (cell size, spatial reference, and grid origin) used for projection/alignment before compositing. If origin isn't provided, the origin will be the upper left corner of the spatial reference. If spatial reference also isn't provided, the origin will be (0, 0). | No |
set | set | Sets output tile width and height in pixels. | No |
Examples
Composite bands
# Imports
from geoanalytics.tools import CompositeBands
from geoanalytics.sql import functions as ST
from geoanalytics.raster import functions as RT
# Path to the AIS positions reported by passenger vessels
raster_path = "https://tiledimageservices.arcgis.com/P3ePLMYs2RVChkJx/arcgis/rest/services/Global_Ship_Density_Passenger/ImageServer"
# passenger vessels around the coast of Miami
raster1_df = spark.read.format("image-service").option("extent", "-80.30, 25.55, -80.10, 25.98").load(raster_path)
# Path to the AIS positions reported by oil and gas vessels
raster_path = "https://tiledimageservices.arcgis.com/P3ePLMYs2RVChkJx/arcgis/rest/services/Global_Ship_Density_Oil_and_Gas/ImageServer"
# oil and gas vessels around the coast of Miami
raster2_df = spark.read.format("image-service").option("extent", "-80.30, 25.55, -80.10, 25.98").load(raster_path)
# Use the CompositeBands tool to create one raster that has one band for the passenger vessels and one band for the oil and gas vessels.
result = CompositeBands()\
.addRaster(raster1_df, "raster", [1])\
.addRaster(raster2_df, "raster", [1])\
.run()
# The result will show the composite raster that has two bands and includes both types of vessels.
result.select("composite_raster",
RT.num_rows("composite_raster").alias("rows"),
RT.num_columns("composite_raster").alias("cols"),
RT.num_bands("composite_raster").alias("num_bands")).show(truncate=False)Result
+-------------------------+----+----+---------+
|composite_raster |rows|cols|num_bands|
+-------------------------+----+----+---------+
|SqlRaster(2x40x87, Int32)|87 |40 |2 |
+-------------------------+----+----+---------+Plot results
Python
# Visualize the raster
result_plot = result.rt.plot(figsize=(10,10), basemap="light")
result_plot = result.select(RT.extent("composite_raster", 4326)).st.plot(ax=result_plot, facecolor="none", edgecolor="none")
result_plot.set_title("Passenger and oil/gas vessels around the coast of Miami", {'fontsize': 11})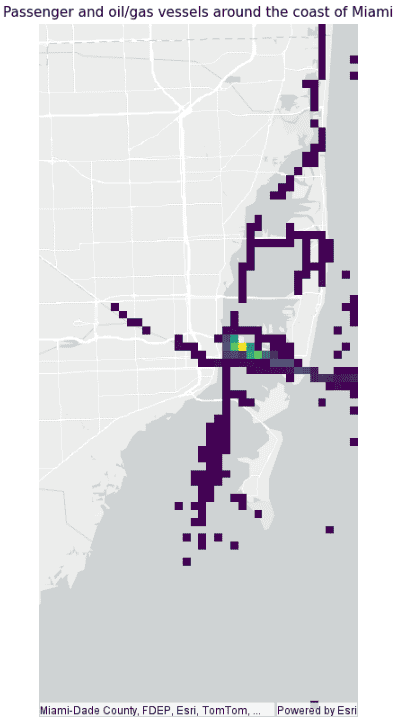
Version table
| Release | Notes |
|---|---|
2.1.0 | Python tool introduced |
2.1.0 | Scala tool introduced |