Summarize Within calculates statistics in areas where geometries from the input DataFrame are within or overlap specified boundaries. The boundaries can be a polygon geometry column or you can summarize within hexagonal or square bins.

Usage notes
-
Summarize Within takes a DataFrame and a boundary, and stacks them on top of each other. After stacking, you can look down through the stack and count the number of summarized input records that fall within the input boundaries. You can also calculate statistics about the attributes of the input summary records, such as minimum, maximum, sum, mean, weighted mean, and so on.
-
There are two ways to specify the boundaries:
- Use a polygon DataFrame by specifying
set.Summary Polygons() - Use a square or hexagonal bin of a specified size that is generated
when the analysis is run by specifying
set.Summary Bins()
- Use a polygon DataFrame by specifying
-
The bin size specifies how large the bins are. If you are summarizing into hexagons, the size is the height of each hexagon, and the radius of the resulting hexagon will be the height divided by the square root of three. If you are aggregating into squares, the bin size is the height of the square, which is equal to the width. If you are summarizing into H3 bins, the size is the H3 resolution, with 0 being the lowest resolution (largest bins) and 15 being the highest (smallest bins).

-
Use Summarize Within to calculate standard statistics as well as geographically weighted statistics. Standard statistics summarize the statistical values without weighting. Weighted statistics calculate values using the geographically weighted attributes of lines within a polygon, or the attributes of polygons within a polygon. Weighted statistics do not apply to points within polygons.
-
Most numeric attributes represent quantities that fall into one of two broad categories: counts and rates. These are defined as follows:
- Counts—Attributes that represent a sum or quantity of an entity at a point location, along a line, or within a polygon. Examples of count-type attributes include the population of a country, the number of taxi pickups in a census block, and the number of dams along a river. You may choose to proportion count-type attributes prior to calculating statistics. Values are proportioned according to the amount of a line within a polygon or the amount of a polygon within another polygon. This provides an estimate of the attribute amount within the summary area. For example, say you want to summarize service area polygons into a county boundary. Each service area has an attribute representing the count of customers within the service area. One particular service area has 100 customers, but only 40% of its area intersects the county boundary. To estimate the number of customers both within the service area and within the county boundary, you could proportion the value, resulting in a count of 40 customers (100 x 0.4). This proportioned count would then be used to calculate either standard or geographically weighted statistics.
- Rates—Attributes that represent a ratio or index at a point location, along a line, or within a polygon. Examples of rate-type attributes include the population density of a country, the speed limit of a road, or the walkability score of a neighborhood. Rate-type values should never be proportioned prior to calculating statistics.
Attribute values are never proportioned when summarizing points.
- You can calculate the lengths and areas of the summarized geometries within each polygon using the options in the table below. Options are based on the geometry of the summarized DataFrame.
| Input geometry | Description | Option |
|---|---|---|
| Points | The count of summarized points within each boundary. | None |
| Linestrings | The length of summarized linestrings within or intersecting each boundary. |
|
| Polygons | The area of summarized polygons within or intersecting each boundary. |
|
-
For standard statistics, there are ten options: count, sum, mean, minimum, maximum, range, standard deviation, variance, first, and last. Note that count and sum should not be calculated for rate-type attributes. There are four options for string statistics: count, any, first, and last.
-
For weighted statistics, there are three options: mean, standard deviation, and variance. Weighted statistics are not calculated for string data.
-
To calculate first or last, time needs to be enabled on the input DataFrame.
-
Analysis with binning requires that your input DataFrame's geometry has a projected coordinate system. If your data is not in a projected coordinate system, the tool will transform your input to a World Cylindrical Equal Area (SRID: 54034) projection. You can transform your data to a projected coordinate system by using ST_Transform.
-
Optionally, specify a field name using
setso statistics are calculated separately for each unique field value. When a group by field value is specified, a summary table listing each record and statistic is also created.Group By() -
The options
includeand_minor _major _fields includeare part of the group by option (_group _percentages set). The minority and majority will be the least and most dominant value from the group field, respectively, where dominance is determined using the count of points, total length, or total area of each value.Group By() -
When the specified value for
includeis_minor _major _fields True, two fields will be added to the result DataFrame. The fields will list the values from the group field that are the minority and majority for each result. -
The
includeoption can only be used when you specify a value of True for_group _percentages include. When the value specified for_minor _major _fields includeis_group _percentages True, two fields will be added to the result DataFrame listing the percentage of the count of points, total length, or total area that belong to the minority and majority values for each input record. A percentage field will also be added to the result table listing the percentage of the count of points, total length, or total area that belong to all values from the group by field for each input record. -
The output DataFrame always contains polygons. Only polygons that intersect the summarized geometries will be returned. Other polygons will be completely removed from the result.

Limitations
- You can only calculate statistics on the records that intersect your boundary.
Results
The following fields are included in the output polygon DataFrame:
| Field | Description |
|---|---|
bin | The result bin geometries. |
count | The count of summarized records that intersect each boundary. |
sum | The total length of linestrings within or intersecting the boundary or total area of summarized polygons within or intersecting a polygon. These values are returned when you specify a value of True for include and are returned in the specified unit. |
<statistic | Specified standard statistics will each create a field named in the following format: <statistic. For example, the maximum and standard deviation of the field id is MAX_id and SD_id. |
w | Specified weighted statistics will each create a field named in the following format: w. For example, the mean and standard deviation of the field pop is wMEAN_pop and wSD_pop. |
minority | This value is returned when you create a group-by table and specify minority and majority calculations. This represents the values for the specified field that is the minority in each polygon. For example, there are five points within a polygon with a field called color and values of red, blue, blue, green, green. If you create a group by the color field, the value for the minority_color field is red. |
majority | This value is returned when you create a group-by table and specify minority and majority calculations. This represents the values for the specified field that is the majority in each polygon. For example, there are five points within a polygon with a field called color and values of red, blue, blue, green, green. If you create a group by the color field, the value for the majority_color field is blue;green. |
minority | This value is returned when you create a group-by table and specify percent shapes. This represents the percentages of the count for the specified field that is the minority in each polygon. For example, there are five points within a polygon with a field called color and values of red, blue, blue, green, green. If you create a group by the color field, the value for the minority_color_percent field is 20 (calculated as 1/5). |
majority | This value is returned when you create a group-by table and specify percent shapes. This represents the percentages of the count for the specified field that is the majority in each polygon. For example, there are five points within a polygon with a field called color and values of red, blue, blue, green, green. If you create a group by the color field, the value for the majority_color_percent field is 40 (calculated as 2/5). |
join | This value is returned when you create a group-by table. This is an ID to link records to the group-by table. Every join_id field corresponds to one or more records in the group-by table. |
The following fields are included in the output group-by DataFrame:
| Field | Description |
|---|---|
join | This is an ID to link records to the polygon DataFrame. Each polygon will have one or more records with the same ID that represent all of the group-by values. For example, there are five points within a polygon with a field called color and values of red, blue, blue, green, green. The group-by table will have three records representing that polygon (same join ID), one for each of the colors red, blue, and green. |
count | The count of the specified group within the joined polygon. For example, red is 1 for the selected polygon. |
<statistic | Any specified statistic calculated for each group. |
percentcount | The percentage each group contributes to the total count in the polygon. Using the above example, red contributes 1/5 = 20, blue contributes 2/5 = 40, and green contributes 2/5 = 20. |
Performance notes
Improve the performance of Summarize Within by doing one or more of the following:
-
Only analyze the records in your area of interest. You can pick the records of interest by using one of the following SQL functions:
- ST_Intersection—Clip to an area of interest represented by a polygon. This will modify your input records.
- ST_BboxIntersects—Select records that intersect an envelope.
- ST_EnvIntersects—Select records having an evelope that intersects the envelope of another geometry.
- ST_Intersects—Select records that intersect another dataset or area of intersect represented by a polygon.
- If you are using bins, larger bins will perform better than smaller bins. If you are unsure which size to use, start with a larger bin to prototype.
Similar capabilities
Syntax
For more details, go to the GeoAnalytics Engine API reference for summarize within.
| Setter (Python) | Setter (Scala) | Description | Required |
|---|---|---|---|
add | add | Adds a standard summary statistic of a field in the input DataFrame to the result DataFrame. Statistics for numeric fields include Count, Sum, Mean, Max, Min, Range, Stddev, Var, First, Last, or Any. Count and sum will not be calculated for rate-type fields. There are four options for string statistics: Count, Any, First, and Last. When proportion is True, numeric values will be scaled by the percentage of the summarized geometry that intersects the summary polygon/bin. This is useful when the field value represents a count or amount, and you want to estimate the count or amount within the summary polygon/bin prior to calculating statistics. Values that represent rates or indices should never be proportioned. The default is False. | No |
add | add | Adds a weighted summary statistic of a field in the input DataFrame to the result DataFrame. Statistics include Mean, Stddev, and Var. Weighted statistics are not calculated for string fields. When proportion is True, numeric values will be scaled by the percentage of the summarized geometry that intersects the summary polygon/bin. This is useful when the field value represents a count or amount, and you want to estimate the count or amount within the summary polygon/bin prior to calculating statistics. Values that represent rates or indices should never be proportioned. The default is False. | No |
include | include | Sets to the tool to calculate statistics based on the geometry type of the primary geometry column in the input DataFrame, such as the length of lines or areas of polygons within each summary polygon. | No |
run(dataframe) | run(input) | Runs the Summarize Within tool using the provided DataFrame. | Required for Python. For Scala, one of run() or run is required. |
run | run | Runs the Summarize Within tool using the provided DataFrame. | For Scala, one of run() or run is required. |
set | set | Sets a field from the input DataFrame that will be used to calculate statistics for each unique value. When set is called along with run, the tool will return a DataFrame containing the grouped statistics in addition to a DataFrame containing the summaries. | No |
set | set | Sets the size and shape of bins that the input DataFrame will be summarized into. bin can be Square, Hexagon, or H3. bin can be Meters, Kilometers, Feet, Miles, Nautical, Yards, or H3 (for H3 bins). | One of set or set is required. |
set | set | Sets the DataFrame containing a column of polygons that the input DataFrame will be summarized into. | One of set or set is required. |
Examples
Run Summarize Within
# Imports
from geoanalytics.tools import SummarizeWithin
from geoanalytics.tools import ReconstructTracks
from geoanalytics.sql import functions as ST
from pyspark.sql import functions as F
# Path to the hurricane tracks dataset
hurricanes_data_path = r"https://services2.arcgis.com/FiaPA4ga0iQKduv3/arcgis/rest/" \
"services/IBTrACS_ALL_list_v04r00_points_1/FeatureServer/0"
# Create a hurricanes tracks DataFrame and filter to a smaller extent of area
hurricanes_df = spark.read.format("feature-service").load(hurricanes_data_path) \
.withColumn("bbox_intersects", ST.bbox_intersects("shape",-10512137.72, -9527997.38,3278846.39,4303954.46)) \
.where("bbox_intersects == 'true'") \
.where("BASIN == 'NA'")
# Use Reconstruct Tracks to create hurricane paths
rt_result = ReconstructTracks() \
.setTrackFields("NAME") \
.setDistanceMethod(distance_method="Planar") \
.run(dataframe=hurricanes_df)
# Use Summarize Within to summarize hurricane tracks into bins to visualize a track heat map
result = SummarizeWithin() \
.setSummaryBins(bin_size=200, bin_size_unit="Kilometers", bin_type='hexagon') \
.includeShapeSummary(include=True, units="Kilometers") \
.run(dataframe=rt_result)
# Show the first 5 rows of the result DataFrame
result.select("COUNT", F.round("sum_length_kilometers",9).alias("sum_length_kilometers")) \
.sort("COUNT", "sum_length_kilometers", ascending=False).show(5)+-----+---------------------+
|COUNT|sum_length_kilometers|
+-----+---------------------+
| 72| 48042.054014933|
| 70| 52851.841917002|
| 70| 48099.067683122|
| 68| 52716.774024942|
| 68| 47228.552737106|
+-----+---------------------+
only showing top 5 rowsPlot results
# Plot the summarized result with shorelines (continent outlines) near Florida
continents_path = "https://services.arcgis.com/P3ePLMYs2RVChkJx/ArcGIS/rest/" \
"services/World_Continents/FeatureServer/0"
shoreline_df = spark.read.format("feature-service").load(continents_path)
result_plot = result.st.plot(cmap_values="COUNT",
cmap="coolwarm",
figsize=(14,8),
legend=True,
basemap="light")
shoreline_plot = shoreline_df.st.plot(edgecolors="black",
alpha=0.3,
figsize=(14,8),ax=result_plot)
result_plot.set_title("Hurricane track heat map near Florida and the Gulf of Mexico")
result_plot.set_xlim(left=-10512137, right=-8027997)
result_plot.set_ylim(bottom=2688846, top=4303954)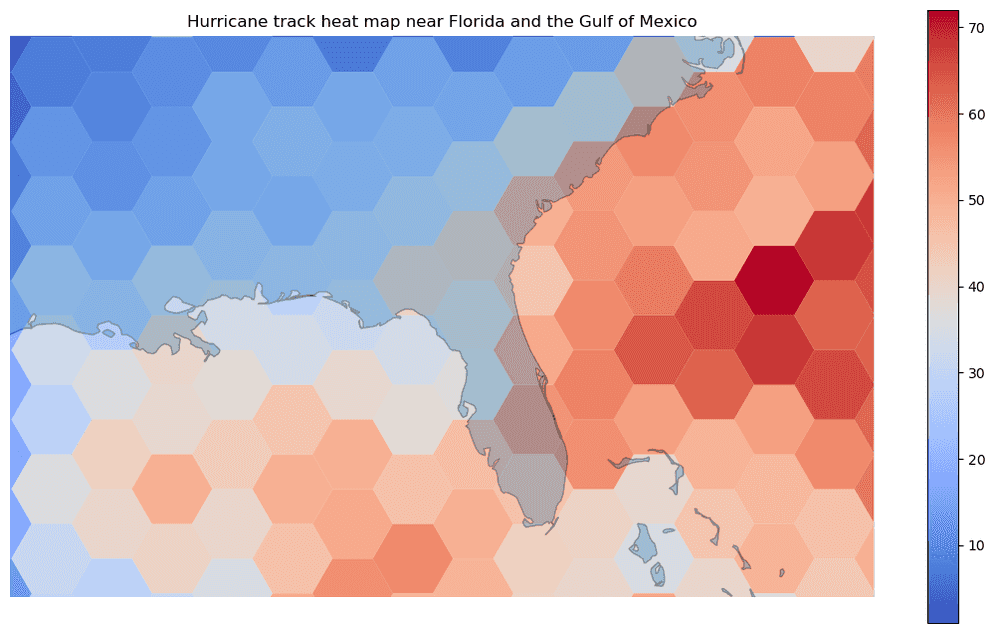
Version table
| Release | Notes |
|---|---|
1.0.0 | Python tool introduced |
1.6.0 | Scala tool introduced |