Find Dwell Locations determines dwell locations from time-sequential points in a track. Dwell locations are defined as sequential observations with little or no movement over a certain period of time.
Depending on the field of application, this may be referred to as stay points or idle detection. Tracks are identified by one or more track fields. The result DataFrame contains the dwell locations as points, a convex hull of the dwell locations, or a mean center point of the dwell. The result also contains the count of points within a dwell location, the start and end time of the dwell, the duration of the dwell, and any additional statistics that have been calculated. Each track can have 0, 1, or more dwell locations.

Usage notes
| Term | Description |
|---|---|
| Dwell location | Locations representing a track that has been stationary relative to the specified time and distance values. The output represents dwell locations as points, convex hulls, or mean centers. |
| Geodetic | A line drawn on a sphere. A geodetic line drawn on the globe represents the curvature of the earth's geoid. |
| Instant | A single moment in time represented by a start time and no end time. |
| Interval | A duration of time represented by a start time and an end time. |
| Observation | A point in a track. |
| Planar | A straight-line distance as measured on a flat surface (that is, a Cartesian plane). This is also referred to as Euclidean distance. |
| Track | A sequence of point observations that are time enabled with time type instant. Rows are determined to be in the sequence by a track identifier field and are ordered by time. For example, a city can have a fleet of snow plow trucks that record their location every 10 minutes. The vehicle ID can represent the distinct tracks. |
-
The input DataFrame must have time-enabled points that represent an instant in time.
-
Dwell locations are defined as sequential observations with little or no movement over a certain period of time.
-
Results are points representing instants in time, or polygons representing an interval in time. The start and end of the interval are determined by the time of the first and last points in a dwell.
-
Dwell locations can only be detected in tracks with more than one point.
-
Tracks are represented by the unique combination of one or more track fields. Specify one or more fields to identify tracks using
set.Track Fields()
-
Distances are calculated using the geodetic distance method by default when your input geometries are not projected. To override this default behavior, use
set. It is recommended that you use geodetic distance in the following circumstances:Distance Method() -
Tracks cross the antimeridian—When using the geodetic method, input DataFrames that cross the antimeridian will have tracks that correctly cross the antimeridian. Your input DataFrame or processing spatial reference must be set to a spatial reference that supports wrapping around the antimeridian, for example, a global projection such as World Cylindrical Equal Area.
-
Your DataFrame is not in a local projection—If your input DataFrame is in a local projection, use the planar distance method. For example, use the planar method to examine trace events within a single state. Your input DataFrame or processing spatial reference must be set to a spatial reference local to your dataset.
-
- You must use
setif your input data is in a projected coordinate system.Distance Method()
- Output dwell locations can be represented in five ways. The following table shows an example of each:
| Output type | Description | Example |
|---|---|---|
| All points | Every point is returned even if it is not part of a dwell. The resulting points have time type instant. Only a count statistic is calculated for this output type. The count represents the number of rows that belong to a single dwell. Non-dwell points will have a count of 0. |

|
| Dwell points | Only points that are part of a dwell are returned. The resulting points have time type instant. Only a count statistic is calculated for this output type. The count represents the number of points that belong to a single dwell. |

|
| Mean centers | Each dwell has a single point returned representing the mean center of the dwell in distance and time. The resulting points have time type interval. The count of points in the dwell is always calculated. You can optionally calculate statistics on this type of dwell result. By default, no statistics are calculated. |

|
| Convex hulls | Each dwell is represented by a convex hull polygon of the dwell result. The resulting rows have time type interval. The count of rows in the dwell is always calculated. You can optionally calculate statistics on this type of dwell result. By default, no statistics are calculated. |

|
| Collapse dwell points | Each dwell is represented by two dwell points, one is the start point of the dwell, the other is the end point of the dwell. In addition, all points that are not part of a dwell are also returned. The resulting points have time type instant. The count of points in the dwell is always calculated. |

|
-
You can optionally split tracks using
set. This splits tracks based on defined time intervals. Applying a time boundary split segments tracks at a defined interval. For example, if you set the time boundary to 1 day, starting at 9:00 a.m. on January 1, 1990, each track will be truncated at 9:00 a.m. every day. This split accelerates computing time, as it creates smaller tracks for analysis. If splitting by a recurring time boundary makes sense for your analysis, it is recommended for big data processing.Time Boundary Split() -
When choosing parameters to calculate dwell locations, consider the type of observation and the scale of dwell that you want to find. The following are examples of how to specify dwell calculations:
-
Ship DataFrame that has
vesselandID tripfields.ID -
Use the
vesselandID tripfields as the identifiers to calculate dwell locations along distinct routes.ID -
Use a time tolerance of 1 hour and a distance tolerance of 1 nautical mile to discover where vessels stay within 1 nautical mile for at least 1 hour.
-
-
Animal tracker DataFrame that has an
animalfield.ID -
Use the
animalfield as the identifier to compare dwell locations of specific animals.ID -
To determine the range of an animal, use a time tolerance of 3 days, and a distance tolerance of 10 miles to discover animal habitats of interest.
-
For a smaller area of interest, use a time tolerance of 2 hours, and a distance tolerance of 100 meters.
-
-
Limitations
-
Inputs must be point DataFrames with time-enabled records of time type instant.
-
Any points that do not have time will not be included in the analysis.
-
The
Dwellassigned to the same dwell output geometry could change after rerunning the tool. Try persisting the output by callingID .persist()on the output DataFrame before querying theDwellfield.ID -
When calculating the convex hull and a dwell location is completely stationary (one unique location) or composed of two unique points, a small value based on the tolerance of the spatial reference used in an analysis will be used as the width, height, or diameter to create output polygons instead of convex hulls. These polygons can be used for visualization and do not represent the spatial extent of the dwell. Examples of these cases are described in the following table:
| Input case | Description | Example |
|---|---|---|
| Coincident (one spatially-unique location) | If the input rows are stacked (coincident), the resulting convex hull will be an invalid polygon. In this example, the coincident input rows are represented by the red dot in the center of the yellow polygon. The yellow polygon represents the output convex hull result for coincident points. The blue polygon represents what a true convex hull looks like when there are four noncoincident points in a single dwell location. |

|
| Colinear (two spatially-unique locations) | If the input rows are in a line (most common with two spatially-unique locations), the resulting convex hull will be an invalid polygon. In this example, colinear points are represented by red dots in the yellow polygon. The yellow polygon represents the output convex hull result for colinear points. |

|
Results
When the output type is', ', or ', all fields from the input DataFrame are
included in the output records, as well as these additional fields:
| Field | Description |
|---|---|
COUNT | The number of points that were in the dwell. |
Dwell | A unique ID for the dwell. Points with the same Dwell are in the same detected dwell. |
Dwell | Duration of dwell time in milliseconds. This is calculated as the difference between the first and last record in the dwell. |
Mean | The mean value of the x-coordinates that compose the dwell. |
Mean | The mean value of the y-coordinates that compose the dwell. |
Mean | The average distance between consecutive points in a dwell location. |
When the output type is ' or ', the only input fields that will be included in the output
records are the fields used in set, as well as these additional fields:
| Field | Description |
|---|---|
COUNT | The number of points that were in the dwell. |
Dwell | A unique ID for the dwell. Points with the same Dwell are in the same detected dwell. |
Dwell | Duration of dwell time in milliseconds. This is calculated as the difference between the first and last record in the dwell. |
dwell | The output geometry for the dwell. The geometry will either be a point (') or polygon ('). |
dwell | The start time of the dwell. |
dwell | The end time of the dwell. |
Mean | The mean value of the x-coordinates that compose the dwell. |
Mean | The mean value of the y-coordinates that compose the dwell. |
Mean | The average distance between consecutive points in a dwell location. |
<statistic | Specified statistics of specified fields. These are returned based on add inputs. |
Performance notes
Improve the performance of Find Dwell Locations by doing one or more of the following:
-
Only analyze the records in your area of interest. You can pick the records of interest by using one of the following SQL functions:
- ST_Intersection—Clip to an area of interest represented by a polygon. This will modify your input records.
- ST_BboxIntersects—Select records that intersect an envelope.
- ST_EnvIntersects—Select records having an evelope that intersects the envelope of another geometry.
- ST_Intersects—Select records that intersect another dataset or area of intersect represented by a polygon.
- Specify a value of
DwellorPoints DwellusingMean Centers set.Output Type() - Subdivide tracks as much as possible by using
setinputs.Track Field() - Split the tracks using
set.Time Boundary Split()
Similar capabilities
The following tools perform similar capabilities:
- Reconstruct Tracks
- Calculate Field
- Calculate Motion Statistics
- Snap Tracks
- TRK_FindDwells
- TRK_CollapseDwells
How Find Dwell Locations works
-
Dwell locations are determined using both time (
set) and distance (Dwell Min Duration() set) values. First, the tool assigns points to a track using a unique identifier (Dwell Max Distance() set). Track order is determined by the recorded time for each point. Then the distance between the first observation in a track and the next is calculated. Points are considered to be part of a dwell if two temporally consecutive points stay within the given distance for at least the given duration. When two points are found to be part of a dwell, the first point in the dwell is used as a reference point, and the tool finds consecutive points that are within the specified distance of the reference point in the dwell. Once all points within the specified distance are found, the tool collects the dwell points and calculates their mean center. Points before and after the current dwell are added to the dwell if they are within the given distance of the dwell location's mean center. This process continues until the end of the track.Track Fields() -
Input DataFrames are summarized into dwell locations using a unique identifier. For all output types, count of points and time duration are calculated for each dwell location.
-
If you selected a summarized output option (
DwellorMean Centers Dwell), each track can optionally apply numeric statistics (Count, Sum, Minimum, Maximum, Range, Mean, Standard Deviation, Variance, First and Last) or string statistics (Count, Any, First and Last) for the rows summarized within a track usingConvex Hulls add.Summary Field() -
The First and Last statistics return the first or last value in a track. For example, with a time-ordered track with the following values: [
Toronto,Guelph,Montreal], the first value isToronto, and the last value isMontreal. -
The count statistic (for strings and numeric fields) counts the number of non-null values. The count of the following values equals 5: [
0,1,10,5,null,6] = 5. The count of this set of values equals 3: [Primary,Primary,Secondary,null] = 3.
Syntax
For more details, go to the GeoAnalytics Engine API reference for find dwell locations.
| Setter (Python) | Setter (Scala) | Description | Required |
|---|---|---|---|
run(dataframe) | run(input) | Runs the Find Dwell Locations tool using the provided DataFrame. | Yes |
add | add | Adds a summary statistic of a field in the input DataFrame to the result DataFrame. | No |
set | set | Sets the method used to calculate distances between track observations. There are two methods to choose from: ' or '. See Usage notes for the default option. | Required when track observations have projected coordinates. |
set | set | Sets the maximum distance between points for them to be considered part of a single dwell event. | Yes |
set | set | Sets the minimum time between points for them to be considered part of a single dwell event. | Yes |
set | set | Sets the result type. Options include '(default), ', ', ', or ' | No |
set | set | Sets boundaries to limit calculations to defined spans of time. | No |
set | set | Sets one or more fields used to identify distinct tracks. | Yes |
Examples
Run Find Dwell Locations
# Imports
from geoanalytics.tools import FindDwellLocations
from geoanalytics.sql import functions as ST
from pyspark.sql import functions as F
# Path to the Seattle example tracks data
data_path = r"https://services1.arcgis.com/36PP9fe9l4BSnArw/arcgis/rest/" \
"services/seattle_example_tracks/FeatureServer/0"
# Create a DataFrame from the Seattle example tracks data
df = spark.read.format("feature-service").load(data_path)
# Use Find Dwell Locations to find where users do not move more than 30 meters
# for at least 5 minutes
result = FindDwellLocations() \
.setTrackFields("user_id") \
.setDistanceMethod(distance_method="Planar") \
.setDwellMaxDistance(max_distance=30, max_distance_unit="Meters") \
.setDwellMinDuration(min_duration=5, min_duration_unit="Minutes") \
.setOutputType(output_type="Dwellpoints") \
.run(dataframe=df)
# Convert DwellDuration from milliseconds to minutes
result = result.withColumn("DwellDuration_minutes", F.col("DwellDuration") / 60000)
# Show the first 5 dwell result records from the result
result.filter(result["user_id"] == 'user3') \
.select("user_id", "COUNT", "DwellDuration_minutes", "MeanDistance") \
.sort("MeanDistance", ascending=False).show(5)+-------+-----+---------------------+-----------------+
|user_id|COUNT|DwellDuration_minutes| MeanDistance|
+-------+-----+---------------------+-----------------+
| user3| 35| 34.0|39.45365389971781|
| user3| 35| 34.0|39.45365389971781|
| user3| 35| 34.0|39.45365389971781|
| user3| 35| 34.0|39.45365389971781|
| user3| 35| 34.0|39.45365389971781|
+-------+-----+---------------------+-----------------+
only showing top 5 rowsPlot results
# Plot the dwell locations for user3 to visualize where dwells occur along tracks
seattle_example_tracks_plot = df.where("user_id = 'user3'").st.plot(color="lightgrey",
figsize=(14,8),
basemap="dark")
result_plot = result.where("user_id = 'user3'") \
.st.plot(cmap_values="DwellDuration_minutes",
legend=True,
ax=seattle_example_tracks_plot)
result_plot.set_title("Input locations and dwell locations for user3")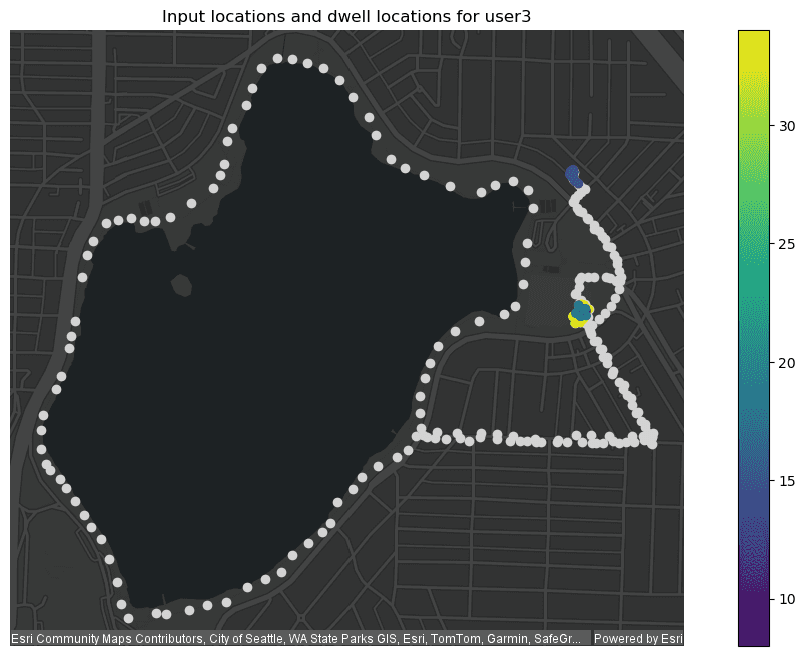
Version table
| Release | Notes |
|---|---|
1.0.0 | Python tool introduced |
1.5.0 | Added support for CollapseDwellPoints as the output type. |
1.6.0 | Scala tool introduced |