Calculate Field calculates field values on a new or existing field. The output will always be a new DataFrame.
Usage notes
-
Calculate Field runs on any DataFrame. A geometry column can be used in calculations but is not required.
-
Calculate Field will always create a new DataFrame. It will not modify the input. You can only calculate values for a single field at a time.
-
You can calculate values for an existing field or for a new field by creating a unique field name.
-
Expressions are created using ArcGIS Arcade. See Arcade expressions for more information.
-
Arcade expressions can be track aware. Track-aware expressions require that the input DataFrame has a single timestamp (instant) and that the track field is specified using
set. To learn more about building track-aware expressions, see Track aware examples.Track Fields() -
Tracks are represented by the unique combination of one or more track fields. For example, if the
flightandID Destinationfields are used as track identifiers, the recordsI,D007 SoldenandI,D007 Tokyowould be in different tracks since they have different values for theDestinationfield. -
Setting
setsegments tracks at a defined interval. For example, if you use a value of 1 day forTime Boundary Split() time, and a value of 9:00 a.m. on January 1, 1990 for the_boundary _split timeparameter, each track will be truncated at 9:00 a.m. every day and analyzed within that segment. This split reduces computing time, as it creates smaller tracks for analysis. If splitting by a recurring time interval boundary makes sense for your analysis, it is recommended for big data processing._boundary _reference
Limitations
-
Only one field can be modified at a time.
-
Calculate Field will always produce a new DataFrame, and will not edit your input DataFrame.
Results
The result is the input DataFrame with a new column appended or an existing column replaced.
Performance notes
Improve the performance of Calculate Field by doing one or more of the following:
-
Only analyze the records in your area of interest. You can pick the records of interest by using one of the following SQL functions:
- ST_Intersection—Clip to an area of interest represented by a polygon. This will modify your input records.
- ST_BboxIntersects—Select records that intersect an envelope.
- ST_EnvIntersects—Select records having an evelope that intersects the envelope of another geometry.
- ST_Intersects—Select records that intersect another dataset or area of intersect represented by a polygon.
- If you are using tracks, split your tracks by using
set.Time Boundary Split()
Similar capabilities
The following tools perform similar capabilities:
You can also perform field calculations directly on your DataFrame with Spark SQL.
Syntax
For more details, go to the GeoAnalytics Engine API reference for calculate field.
| Setter (Python) | Setter (Scala) | Description | Required |
|---|---|---|---|
run(dataframe) | run(input) | Runs the Calculate Field tool using the provided DataFrame. | Yes |
set | set | Sets an Arcade expression used to calculate the new field values. | Yes |
set | set | Sets the name and type of the new field. | Yes |
set | set | Sets boundaries to limit calculations to defined spans of time. | No |
set | set | Sets one or more fields used to identify distinct tracks. | No |
Examples
Run Calculate Field
# Imports
from geoanalytics.tools import CalculateField
from geoanalytics.sql import functions as ST
from pyspark.sql import functions as F
# Path to the Atlantic hurricanes data
data_path = r"https://sampleserver6.arcgisonline.com/arcgis/rest/services/Hurricanes/MapServer/0"
# Create an Atlantic hurricanes DataFrame
df = spark.read.format("feature-service").load(data_path) \
.st.set_time_fields("Date_Time")
# Use Calculate Field to create a new column containing the average windspeed in
# miles per hour based on the previous, current, and next observation in the track.
result = CalculateField() \
.setField(field_name="avg_windspeed", field_type="DOUBLE") \
.setExpression(expression="Mean($track.field['WINDSPEED'].window(-1,2))") \
.setTrackFields("EVENTID") \
.run(dataframe=df)
# View the first 5 rows of the result DataFrame
result.filter(result["EVENTID"] == "Alberto") \
.select("EVENTID", F.date_format("Date_Time", "yyyy-MM-dd").alias("Date_Time"), "WINDSPEED", "avg_windspeed") \
.sort("avg_windspeed", ascending=False).show(5)+-------+----------+---------+------------------+
|EVENTID| Date_Time|WINDSPEED| avg_windspeed|
+-------+----------+---------+------------------+
|Alberto|2000-08-12| 110.0|108.33333333333333|
|Alberto|2000-08-12| 110.0|106.66666666666667|
|Alberto|2000-08-13| 105.0|103.33333333333333|
|Alberto|2000-08-12| 100.0| 100.0|
|Alberto|2000-08-13| 95.0| 95.0|
+-------+----------+---------+------------------+
only showing top 5 rowsPlot results
# Get the world continents data for plotting
continents_path = "https://services.arcgis.com/P3ePLMYs2RVChkJx/ArcGIS/rest" \
"/services/World_Continents/FeatureServer/0"
continents_subset_df = spark.read.format("feature-service").load(continents_path) \
.where("""CONTINENT = 'North America' or
CONTINENT = 'South America' or
CONTINENT = 'Europe' or
CONTINENT = 'Africa'""")
# Plot the Alantic hurricanes data with the continents subset data
continents_subset_plot = continents_subset_df.st.plot(facecolor="none",
edgecolors="lightblue",
figsize=(14,8))
result_plot = result.st.plot(cmap_values="avg_windspeed",
cmap="YlOrRd",
legend=True,
ax=continents_subset_plot,
basemap="light")
result_plot.set_title("Alantic hurricanes average windspeed (miles per hour)")
result_plot.set_xlim(right=10000000)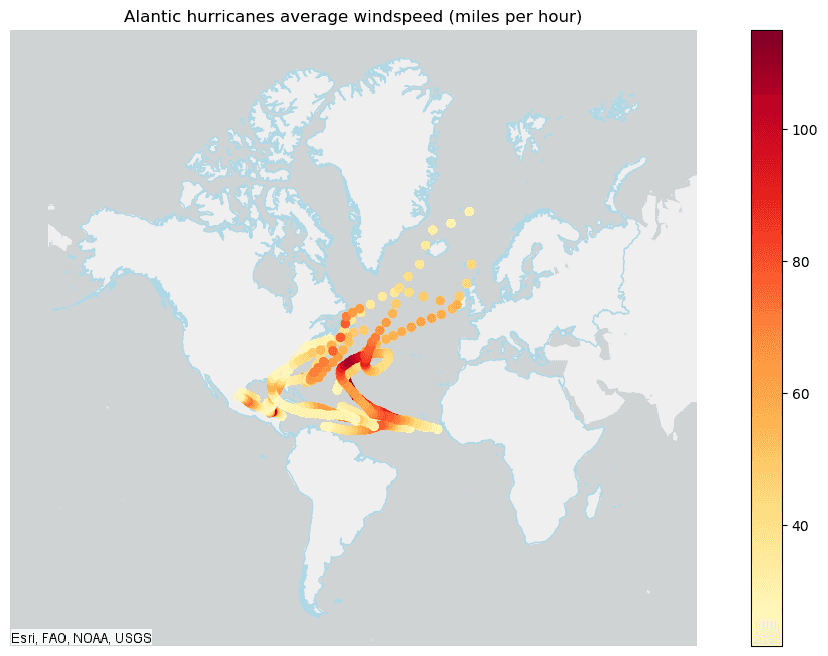
Version table
| Release | Notes |
|---|---|
1.0.0 | Python tool introduced |
1.6.0 | Scala tool introduced |