Overlay combines two DataFrames into a single DataFrame using one of five overlay types: Intersect, Erase, Union, Identity, or Symmetric Difference.

Usage notes
-
Overlay requires that two inputs are specified using the
inputand_dataframe overlayparameters in the_dataframe run()method. The two supported overlay types and input geometries are described in the following tables:Intersect Erase Union Identity Symmetrical Difference Point and point Point and linestring Point and polygon Linestring and point Linestring and linestring Linestring and polygon Polygon and point Polygon and linestring Polygon and polygon Full supportPartial supportNo support -
The following table summarizes the overlay operations:
Overlay type Description  Intersect
The geometries or portions of geometries in the overlay DataFrame that overlap the input DataFrame are returned. This is the default.  Erase
EraseThe geometries or portions of geometries in the input DataFrame that do not overlap the overlay DataFrame are returned.  Union
UnionThe result will contain a geometric union of the input DataFrame and overlay DataFrame. All geometries and attributes will be returned.  Identity
The result will contain geometries or portions of geometries that overlap in both the input DataFrame and overlay DataFrame.  Symmetric Difference
The result will contain geometries or portions of geometries of the input DataFrame and the overlay DataFrame that do not overlap. -
When applying the indentity, intersect, symmetric difference, or union overlay types, fields from both DataFrames (
inputand_dataframe overlay) are in the result. If the inputs have the same field names, the overlay fields will be renamed_dataframe fieldname. For example, if your_overlay inputhad the fields_dataframe countyandstate, and theoverlayhad the field_dataframe county, your output DataFrame would have the fieldscounty,state, andcounty._overlay
Limitations
Sliver polygon results may be excluded based on the tolerance of the processing spatial reference.
Results
The tool outputs records that include the following fields in addition to the input fields:
| Field | Description |
|---|---|
overlay | If your input had a geometry column, a new field named geometry is created. |
Fields from the overlay | When you use identity, intersect, symmetric difference, or union overlay type. |
Performance notes
Improve the performance of Overlay by doing one or more of the following:
-
Only analyze the records in your area of interest. You can pick the records of interest by using one of the following SQL functions:
- ST_Intersection—Clip to an area of interest represented by a polygon. This will modify your input records.
- ST_BboxIntersects—Select records that intersect an envelope.
- ST_EnvIntersects—Select records having an evelope that intersects the envelope of another geometry.
- ST_Intersects—Select records that intersect another dataset or area of intersect represented by a polygon.
Similar capabilities
Use the Spatiotemporal join tool if you want to join two DataFrames based on their spatial relationship.
The following functions complete spatial overlay operations:
- ST_Aggr_Intersection
- ST_Aggr_union
- ST_Contains
- ST_Crosses
- ST_Difference
- ST_Dwithin
- ST_Equals
- ST_Intersection
- ST_Intersects
- ST_Overlaps
- ST_SymDifference
- ST_Touches
- ST_Union
- ST_Within
Syntax
For more details, go to the GeoAnalytics Engine API reference for overlay.
| Setter (Python) | Setter (Scala) | Description | Required |
|---|---|---|---|
run(input | run(input, overlay) | Runs the Overlay tool using the provided DataFrames. | Yes |
set | set | Sets the type of overlay to be performed. The default is intersect. | No |
Examples
Run Overlay
# Imports
from geoanalytics.tools import Overlay
from geoanalytics.sql import functions as ST
from pyspark.sql import functions as F
# Paths to the USA rivers and streams data and USA states data
usa_rivers_data_path = "https://services.arcgis.com/P3ePLMYs2RVChkJx/ArcGIS/rest/" \
"services/USA_Rivers_and_Streams/FeatureServer/0"
usa_states_path = "https://services.arcgis.com/P3ePLMYs2RVChkJx/ArcGIS/rest/" \
"services/USA_State_Boundaries/FeatureServer/0"
# Create a USA rivers and streams DataFrame
usa_rivers_and_streams_df = spark.read.format("feature-service") \
.load(usa_rivers_data_path)
# Create a California state boundary DataFrame
california_df = spark.read.format("feature-service").load(usa_states_path) \
.where("STATE_NAME == 'California'") \
.withColumn("shape", ST.transform("shape", 4326))
# Use Overlay to intersect the rivers with the state boundary
# The result will be a DataFrame containing the rivers and streams in California
overlay_result=Overlay() \
.setOverlayType(overlay_type="Intersect") \
.run(input_dataframe=california_df, overlay_dataframe=usa_rivers_and_streams_df)
overlay_result.select("STATE_NAME", "Name", "Feature", "Region", "Miles").sort("Miles", ascending=False).show(5, truncate=False)+----------+-------------------------------------------+-------+------+------+
|STATE_NAME|Name |Feature|Region|Miles |
+----------+-------------------------------------------+-------+------+------+
|California|Governor Edmund G Brown California Aqueduct|Canal |18 |222.93|
|California|Eel River |Stream |18 |162.05|
|California|Sacramento River |Stream |18 |148.73|
|California|Klamath River |Stream |18 |125.53|
|California|Coachella Canal |Canal |18 |123.46|
+----------+-------------------------------------------+-------+------+------+
only showing top 5 rowsPlot results
# Plot the result
california_plot = california_df.st.plot(facecolor="lightblue",
linewidth = 1,
edgecolors="black",
figsize=(12,8),
basemap="light")
result_plot = overlay_result.st.plot(edgecolors="navy", ax=california_plot)
result_plot.set_title("Rivers and streams in California")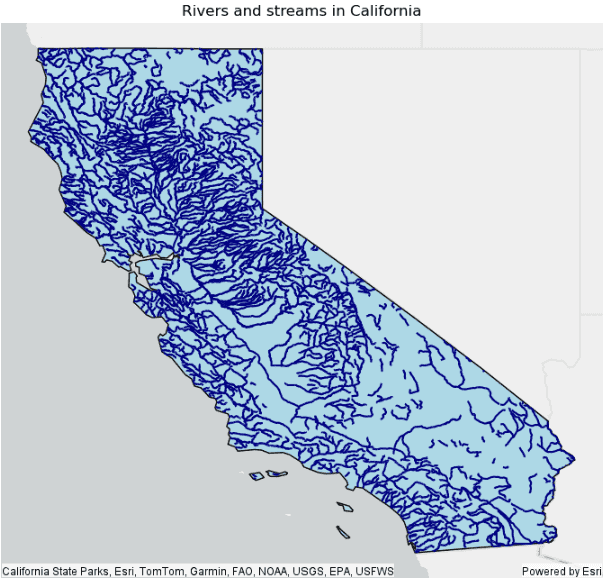
Version table
| Release | Notes |
|---|---|
1.0.0 | Python tool introduced |
1.6.0 | Scala tool introduced |